Brexit’s Biggest Fans in Big Trouble?

Leo Kolivakis is a blogger, trader and independent senior pension and investment analyst. This post was originally published at Pension Pulse.

Andre Tartar and Jill Ward of Bloomberg report, Brexit’s Biggest Fans Face New 115 Billion-Pound Pension Hole:

Turning 65 in the U.K. used to mean mandatory retirement and a future of endless holiday. But in 2016 it has come to signify a very different cut-off: membership in the single most pro-Brexit age group in the June 23 European Union referendum.

About 60 percent of Britons 65 and older voted to leave the world’s largest trading bloc in the recent vote, the most of any age group, according to two separate exit pollsThe glaring irony is that senior citizens are also the most reliant on pensions, which face a worsening funding gap since the Brexit vote.

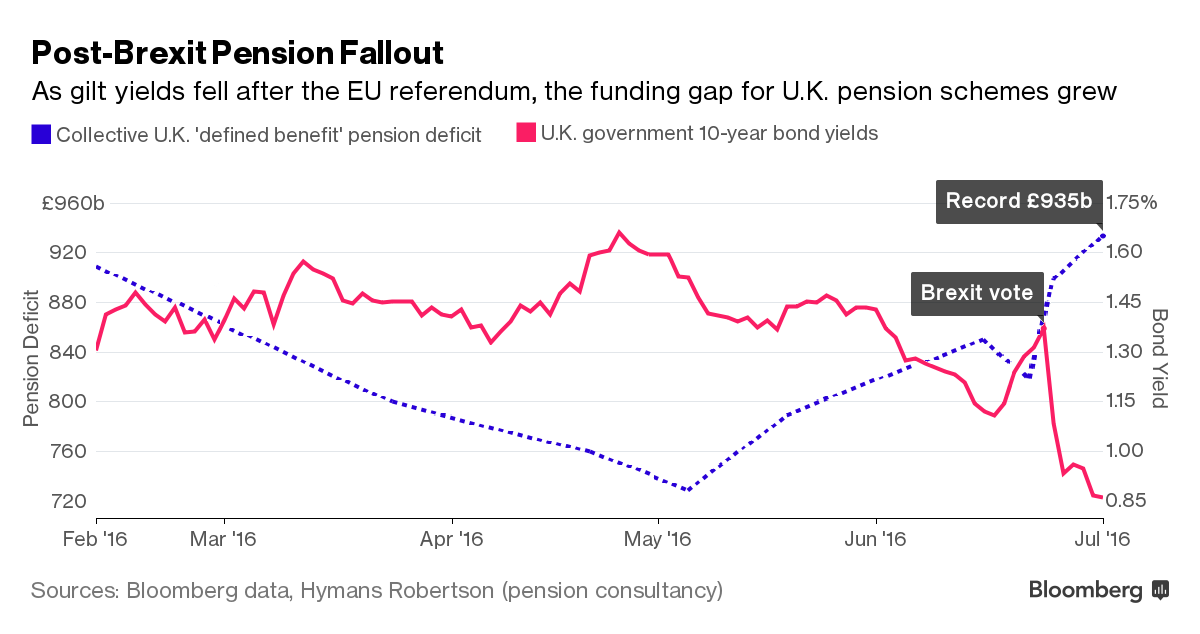
The combined deficits of all U.K. defined-benefit pension schemes, normally employer-sponsored and promising a specified monthly payment or benefit upon retirement, rose from 820 billion pounds ($1.1 trillion) to 900 billion pounds overnight following the referendum, according to pensions consultancy Hymans Robertson. Since then, it has grown further to a record 935 billion pounds as of July 1.

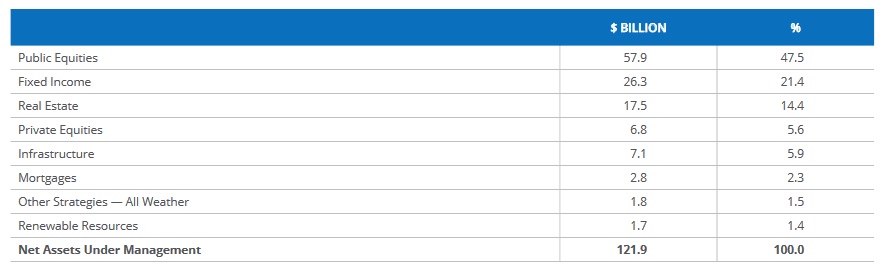
A sharp drop in U.K. government bond yields to record lows, and a similar decline in corporate bond yields, is largely to blame for the uptick in defined-benefit pension liabilities. That’s because fixed income represented 47.5 percent of total 2014 assets for corporate pensions funds, of which about three-quarters were issued by the U.K. government and/or sterling-denominated, according to the 2015 Investment Association Annual Survey.

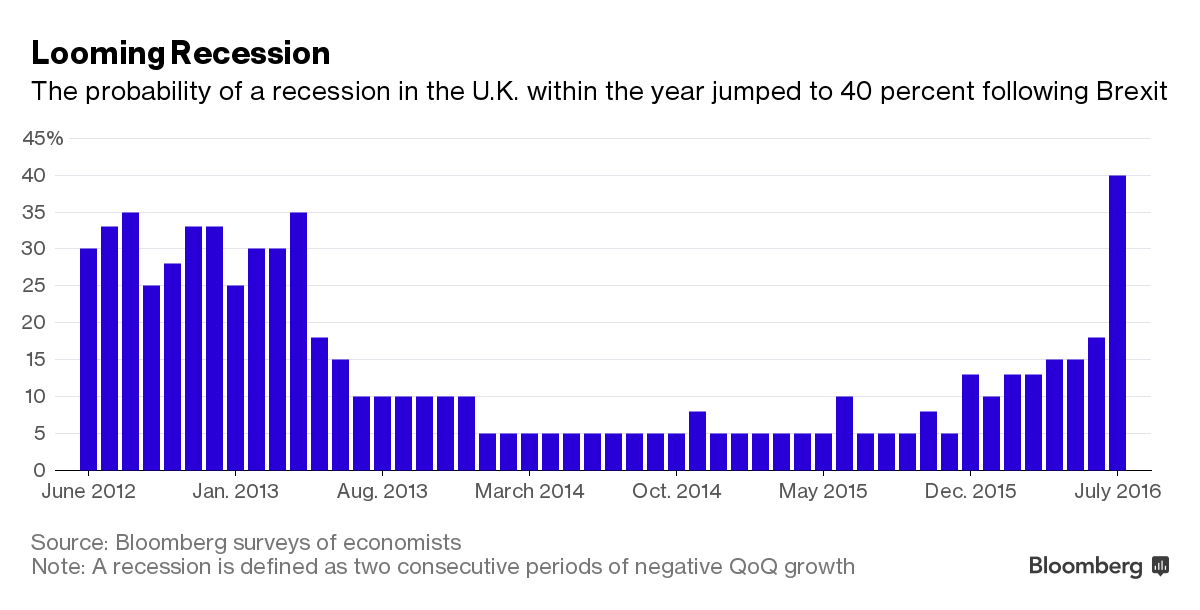
And the slump may not be over yet. While the Bank of England held off on cutting rates or increasing asset purchases at its July 14 meeting, early signals point to serious pain ahead for the U.K. economy. If additional quantitative easing is ultimately required to offset growing uncertainty, this would suggest “that bond yields are going to fall, which makes pensions a lot more expensive to provide,” former pensions minister Ros Altmann told Bloomberg. “Deficits would be larger if gilt yields fall further.”

Beyond gilt yields, Altmann said that anything that damages the economy is also bad news for pensions. The country’s gross domestic product is now expected to grow by 1.5 percent this year and just 0.6 percent in 2017, according to a Bloomberg survey of economists conducted July 15-20. That’s down from 1.8 percent and 2.1 percent, respectively, before the Brexit vote.

A weaker economy means companies will be less able to afford extra contributions precisely when pension schemes face a growing funding gap, possibly threatening future payouts to pensioners and creating a vicious feedback cycle. “If companies have got to put even more into their pension schemes than they have previously while their business is weakening, then clearly their business will be further weakened,” Altmann said.

Bad news, in other words, for Brexit’s biggest supporters.

Very bad news indeed but I guess British seniors weren’t thinking with their wallets as I thought they would when they decided to vote for Brexit.

Zlata Rodionova of the Independent also reports, Brexit supporters hit with record £935bn pension deficit because of the EU referendum:

The UK pension deficit hit a record level of £935 billion following UK’s vote to leave the EU, likely hitting pro-Brexit voters the hardest.

Support for the UK to leave the EU bloc grew with each age category, peaking at 60 per cent among those aged 65 and over, according to a survey of 12,356 referendum voters by Lord Ashcroft.

Ironically, the same voters are reliant on defined benefit pension to deliver their retirement income.

But UK’s pension deficit rose from £830 billion to £900 billion overnight following the EU referendum.

The vote then pushed the gap further to £935 billion as of July 1, according to Hymans Robertson, an independent pension’s consultancy, making it responsible for £115 billion of debt.

Gilt yields, the assets used to help value the cost of future payments, tumbled in the aftermath of the June 23 referendum, as investors bolted in favour of assets with a reputation for safety, putting more pressure on the pension industry.

Record lows in gilt yields in turn pushed the liabilities of UK pension schemes up to an all-time high £2.3 trillion on July 1.

“The gyrations in UK pension deficits are eye-watering. But one of the biggest factors that will determine whether or not pensions are paid to scheme members in full will be the health of the sponsoring company post Brexit,” Patrick Bloomfield, partner at Hymans Robertson, said.

Ros Altman, the former pensions minister, warned pensions could be under threat from the economic turmoil following UK’s vote to leave the EU.

“Good pensions depend on a good economy. Markets don’t like uncertainty, and we are clearly in unchartered territory,” Altmann said at an event in London.

“I hope we will get the political turmoil settled soon and do what we really need to be doing -which is making good policy for everyone in the country – who hopefully one day will be a pensioner if they aren’t one already,” she added.

As British businesses struggle to plan for an uncertain future in the aftermath of Britain’s decision to leave the EU, a worsening funding gap can reduce their scope to borrow money, curb their ability to invest and act as barrier to mergers and acquisitions.

High profile companies Tata Steel and BHS already showed evidence of the impact of pension deficits on investments and deal making this year.

The British Steel pension scheme, backed by Tata, has an estimated deficit of £700 million which has complicated the quest to find a new owner for Tata’s factories.

BHS’s pensions scheme had a £571 million hole when it collapsed. The risk of taking on the pensions burden is thought to be one of the reasons behind BHS’s failure to find backers or buyers for the business as a whole.

The fallout from Brexit on UK pensions is even more widespread than these articles suggest. Rob Langston of Raconteur reports, Brexit shock wave hits pension investors:

The full impact of Britain’s vote to leave the European Union has still to be felt, but uncertainty continues to affect pension investments as challenging times may lie ahead.

Pensions may not have been at the front of many people’s minds when entering the polling booths on June 23, but the Brexit referendum result is likely to have a lasting impact on pension schemes for years to come.

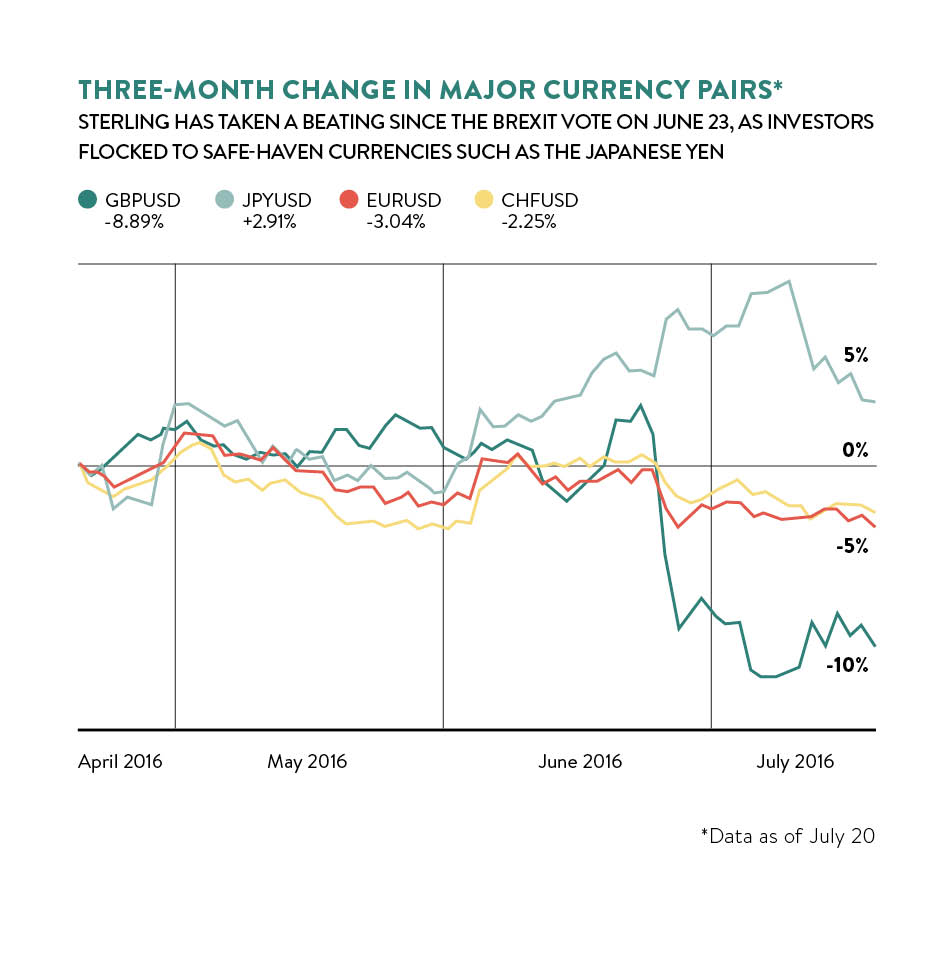
The immediate aftermath saw sterling plunge and markets fall, taking a toll on investors’ savings. But the longer-term effect may be just as significant.

While the impact of the EU referendum on markets may have trustees and pension scheme members seeking out the latest performance of their investments, there have been implications for the pension industry as a whole.

Ongoing annuity rates

For some scheme members close to retirement, the referendum result has had a major impact on their choices as annuity rates fell sharply post-Brexit.

“The cost of buying an annuity has got more expensive for DC [defined contribution] members close to retirement,” says Joanna Sharples, investment principal at consultancy Aon Hewitt. “Post-Brexit it will be really interesting to see how this translates across different annuity providers; however, quotes from one provider suggest that annuities are about 4 per cent more expensive, which is quite meaningful.”

Yet, the introduction of pension freedoms in April 2015 may have offered members a wider range of choices to mitigate the referendum result. Data from insurer and long-term investments industry body ABI suggests that annuity-buying activity has fallen away since the introduction of pension freedoms, with income drawdown products enjoying a corresponding rise in take-up.

Pension freedoms are likely to have a bearing on the type of investment decisions that are made in the post-referendum period, opening up opportunities to members they may not have enjoyed in previous years.

“Pensions freedoms have put existing default life cycles into question and there has been a sizeable shift from annuities to drawdown,” says Maya Bhandari, fund manager and director of the multi-asset allocation team at global asset manager Threadneedle Investments.

“We are now able to start on a blank sheet of paper and ask two crucial questions: what do people want and what do they need? Ultimately what people need is relatively simple tools and solutions that help them identify, manage or mitigate the three risks they face in retirement – financial market volatility, real returns and longevity.”

Brexit-proofing pensions

In light of the uncertainty brought about by Brexit, more scheme members might choose to take greater control over their pension savings. So-called Brexit-proofing pensions may appeal to many investors, although they will face a number of challenges.

“Pensions freedoms are still relatively new, which means people are currently faced with very mixed messages about how best to act in times of market uncertainty,” says Catherine McKenna, global head of pensions at law firm Squire Patton Boggs.

“We already know that one of the biggest trends of 2015 was the rise of the pensions scam and individuals should be careful to guard against Brexit uncertainty being used as a trigger to cash out their fund if this isn’t right for them.”

While the referendum decision and subsequent government shake-up may have ramifications for pension freedoms, any changes to existing pension legislation are unlikely to emerge in the immediate aftermath of the leave vote.

“In terms of legislation on pension freedoms, it is unlikely that the government will look to repeal what is already in place but, irrespective of Brexit, there may be further regulation to impose better value by reducing charges and product design for freedoms to develop,” says Ms McKenna.

Taking greater control of investment decisions in the current environment may pose a number of challenges, however, particularly with the increased level of volatility in markets seen in the wake of the result.

“From an investment perspective, Brexit has created much greater uncertainty and volatility in the markets, and made them more than usually reactive to political events,” says James Redgrave, European retirement director at asset management research and consultancy provider Strategic Insight.

“The FTSE 100 fell 500 points on June 24 – below 6,000 – and savers entitled to access their pots were advised to wait to take cash, if they could afford to do so.

“These markets have settled largely on the quick and orderly transition to a new government, after David Cameron’s resignation, and will have been buoyed by the Bank of England’s conclusion that an interest rate cut is not economically necessary.”

James Horniman, portfolio manager at investment manager James Hambro & Partners, says: “Investors have to position portfolios sensibly with insurance against all outcomes. Sterling is likely to come under continued pressure and there will almost certainly be volatility.

“As long as valuations are not unreasonable, it makes sense to weight any UK equity holdings towards businesses with strong US-dollar earnings rather than those reliant on raw materials from overseas – companies forced by adverse currency movements to pay extra for essential inputs from elsewhere in the world could see their profits really squeezed.”

The impact of home bias is likely to take a toll on some pension investments as fund managers have warned of being too exposed to the UK market. Under normal circumstances higher UK equities exposure may be expected, but the uncertainty introduced by the referendum result in local markets may harm returns.

Long term plans

Experts note that many trustees have already begun diversifying portfolios to mitigate geography and asset risk. The financial crisis remains a fresh memory for many trustees who will have taken a more robust approach to diversification in recent years.

“There’s been a general trend over the past decade of moving away from fund manager mandates that are very specific and narrow to wider mandates, such as global equities or multi-asset,” says Dan Mikulskis, head of defined benefit (DB) pensions at London-based investment consultancy Redington. “Trustees making fund manager changes will be more motivated to move to less constrained mandates.”

Yet, trustees and scheme members may need to get used to new market conditions and a longer-term, low-growth environment.

“Following Brexit, the conversations we’ve been having with investors are similar to those we’ve been having since the start of the year,” says Ana Harris, head of equity portfolio strategists for Europe, the Middle East and Africa at investment manager State Street Global Advisors.

“We haven’t seen a big shift in money or allocations, but there has been some realignment. What we are advising clients is not to be reactive to short-term volatility in the market and make sure plans for long-term investment are in place.”

“In the short term, it is likely there will be quite a lot of volatility in the market and members need to be aware of that,” says Aon Hewitt’s Ms Sharples. “One option is that everybody carries on as before with no change to strategy; however, the other option is trustees think about whether there are better ways of investing and opportunities to provide more diversification or add value.

“For people who are a bit further away from retirement, the key is what kind of returns can they expect going forward? Returns are likely to be lower than before because of pressure on the economy and lower growth expectations. To help offset this, members have the option of paying more in or retiring later, or a combination of both.”

With further details yet to emerge about what access the UK will have to EU markets and restrictions on free movement, the full impact of Brexit remains to be seen.

“Unfortunately, no one has a crystal ball. Even the best investment strategies may be adversely affected by current market volatility, but this is not to say members, trustees or fund managers should begin to panic,” says Ms McKenna of Squire Patton Boggs.

“There is little doubt that Britain leaving the EU will mean there are challenges ahead for investment funds; however, there are also opportunities for trustees to harness innovation and consider new investment portfolios.”

A greater focus on risk management has emerged as trustees attempt to mitigate some of the impact of June’s EU referendum result on pension schemes.

While attention may be focused on markets, pension scheme trustees will also have to consider a number of other risk management issues brought about by Brexit.

“I don’t think pensions should be focusing too much on whether sterling is going up or down, or whether one asset manager is performing,” says Dan Mikulskis, head of defined benefit pensions at investment consultancy Redington.

“Getting a risk management framework set up is sensible. With a simple framework to go by, there will be opportunities in a volatile market environment, but it’s always best left to the asset manager.”

Mr Mikulskis says regular reviewing of investment decisions and performance is likely to depend on the size of the scheme and the governance arrangements, adding that trustees may be put under pressure to communicate more frequently and effectively with scheme members.

Despite low interest rates, trustees should take care over possible liability hedging, while also recognising the challenges presented by a low-yield environment for bonds.

“We don’t think that just because rates are low they can’t fall further,” he says. “A lot of trustees that haven’t hedged will feel like they’ve missed the boat, but there are still risks on the down side.”

There sure are risks to the downside and trustees ignoring the bond market’s ominous warning are going to regret not hedging their liabilities because if you ask me, ultra low rates and the new negative normal are here to stay, especially if the deflation tsunami I’ve warned of hits us.

Brexit isn’t just hitting UK pensions, it’s also going to hit large Canadian pensions which invested billions in UK infrastructure and commercial real estate. They were right to worry about Brexit and if they didn’t hedge their currency risk, they will suffer material losses in the short-term.

However, Canada’s large pensions have a very long investment horizon, so over the long run these losses can become big gains especially if Britain figures out a way to continue trading with the EU after Brexit.

That all remains to be seen. In my opinion, Brexit was Europe’s Minsky moment and if they don’t wake up and fix serious structural deficiencies plaguing the EU, then the future looks bleak for this fragile union.

Brexit’s shock waves are also being felt in Japan where the yen keeps soaring, placing pressure on the Bank of Japan which is also grappling with expansionary fiscal policy. We’ll see what it decides on Friday but investors are bracing for another letdown.

In other related news, while Brexit’s biggest fans are in big trouble, Chris Havergal of the Times Higher Education reports, Bonuses up at USS as pension fund deficit grows by £1.8 billion:

Bonuses at the university sector’s main pension fund have soared, even though its deficit has grown by £1.8 billion.

The annual report of the Universities Superannuation Scheme says that the shortfall between its assets and the value of pensions due to members was estimated to be £10 billion at the end of March, compared with £8.2 billion last year and predating any negative effect of the Brexit vote on pensions schemes.

The health of the fund is due to be reassessed in 2017 and Bill Galvin, its chief executive, said that it was “too early” to say whether contributions from employers and employees would need to be increased.

Despite the expanding deficit, the annual report reveals that the value of bonuses paid to staff rocketed from £10.1 million to £18.2 million last year, with the vast bulk going to the scheme’s investment team.

This contributed to the number of USS employees earning more than £200,000 once salary and bonuses are combined increasing from 29 to 51 year-on-year.

Thirteen staff earned more than £500,000, up from three the year before. While the highest-paid employee in 2014-15 received between £900,000 and £950,000, last year one worker earned about £1.6 million, with another on about £1.4 million.

Mr Galvin told Times Higher Education that the increases reflected a decision to take investment activities in-house that were previously outsourced, and strong investment performance that meant that the deficit was £2.2 billion smaller than it would otherwise have been.

“Although bonuses to the investment teams have gone up, it reflects the fact they have contributed very substantially to keep the deficit from being in a worse position than it is,” Mr Galvin said. “We are delivering a very good value pension scheme, better than any other comparable schemes we have benchmarked.”

The report shows that Mr Galvin’s total remuneration, including pension contributions, increased by 12 per cent in 2015-16, from £432,000 to £484,000.

This comes after a summer of strike action by academics – many of whom will be USS members, particularly at pre-92 universities – over an offer of a 1.1 per cent pay rise for 2016-17.

The increased deficit means that the scheme’s pensions are now estimated to be only 83 per cent funded, compared with the 90 per cent figure predicted by the last revaluation in 2014.

Mr Galvin said that the assumptions made two years ago had been “reasonable”, but that asset values had not kept pace with declining interest rates.

The last revaluation led to the closure of the USS’ final salary pension scheme and an increase in contributions by employers and employees, but Mr Galvin said that a long-term assessment would be taken to determine if further changes were needed.

“Some of the things that will be relevant in the 2017 valuation have gone against [us] in terms of the assumptions we made at the last valuation,” Mr Galvin said. “That is a signal and we will consider what we should do about that…[but] it’s too early to say whether we do need to make any response or what that response might be.”

Mr Galvin added that, while an increase in liabilities since Brexit had been “broadly balanced” with an increase in the value of assets, it was “much too early” to determine the longer term impact of the UK leaving the European Union on the fund.

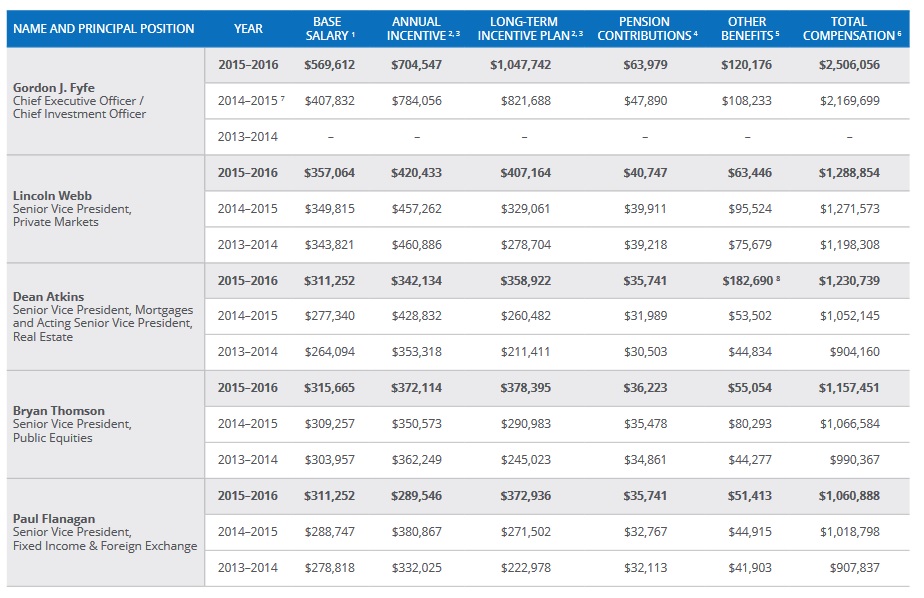
Looks like the Canadian pension compensation model has been adopted in the United Kingdom. That reminds me, I need to update the list of highest paid pension officers, but keep in mind Mr. Gavin is right, taking investment activities in-house saves the scheme money and it requires they pay competitive compensation to their senior investment officers.

Lastly, Elizabeth Pain of Science Magazine reports, Pan-European pension fund for scientists leaves the station:

Old age may not be something European scientists think about as they hop around the continent in search of exciting Ph.D. opportunities, broader postdoctoral experience, or attractive faculty positions. But once they approach retirement age, many realize that working in countries as diverse as Estonia, Spain, or Germany can be detrimental to one’s nest egg.

But now, there is a potential solution: a pan-European pension fund for researchers, called RESAVER, that was set up by a consortium of employers to stimulate researcher mobility. The fund was officially created on 14 July under Belgian law as a Brussels-based organization. Three founding members—the Central European University in Budapest; Elettra Sincrotrone Trieste in Basovizza, Italy; and the Central European Research Infrastructure Consortium headquartered in Trieste, Italy—will soon start making their first contributions. Researchers can also contribute part of their own salary to the fund.

“We have a solution” to preserve the pension benefits of mobile researchers, Paul Jankowitsch, who is the former chair of the RESAVER consortium and now oversees membership and promotion, said earlier this week here at the EuroScience Open Forum (ESOF). “The excuse [for institutions] to do nothing is gone.”

The European Commission has contributed €4 million to the set-up costs of RESAVER, as part of its funding program Horizon 2020. At least in principle, the fund is open to the entire European Economic Area, which includes all 28 E.U. member states except Croatia, as well as Norway, Lichtenstein, and Iceland.

Most European countries offer social security, and it’s usually possible to get access to benefits even if they’re accumulated in another country. But many universities and institutions also provide supplemental pension benefits that are not so easily transferred. Researchers who spend part of their career abroad—even if it’s just a few hundred kilometers from home—can find themselves paying into a variety of supplemental plans, often resulting in lower benefits than they would enjoy if they just stayed put. This puts a damper on scientists’ mobility.

The idea behind RESAVER is to create a common pension fund so that supplemental benefits will simply follow scientists whenever they change jobs or countries. Individual researchers can only join through their employers, which is why it’s essential for the scheme’s success that a large number of institutions around Europe join the initiative.

The big question is whether that will happen. In addition to the three early adopters, the RESAVER consortium, which was created in 2014, has some 20 members so far, together representing more than 200 institutions across Europe. That’s just a tiny fraction of Europe’s research landscape—and even most members of the consortium have not yet committed to joining the fund.

Take-up has been slow for a variety of reasons. According to Jankowitsch, the fund represents a long-term financial risk that many universities and research institutions are not accustomed to. Local factors further complicate matters. In France, many researchers have their pension fully covered by the state as civil servants. Although many institutions in Spain are part of the consortium, there are obstacles in Spanish law to joining a foreign pension fund. And in Germany, researchers at the Max Planck Institutes have little incentive to join because they already enjoy attractive pension packages.

Risk was also a concern for researchers in the audience at this week’s ESOF session. The RESAVER pension plan will be contribution- rather than benefit-based, meaning that researchers will know how much they put in but not how much they’ll get, as they would with many other pension plans in Europe. Although the fund has been conceived as a pan-European risk-pooling investment, Jankowitsch acknowledges that there will always be risks in the capital market.

Some attendees also wondered whether, with so few institutions participating, RESAVER could actually be a barrier to mobility, at least in the short term, by limiting researchers to those institutions. Young researchers worried about inequalities because Ph.D. candidates are employed in some places but are considered students in others, making them ineligible for participation. (The consortium is currently negotiating a private pension plan for researchers who don’t have an employment contract.)

The International Consortium of Research Staff Associations (ICoRSA) would like to see more transparency in the fund’s investment plan and more flexibility and guarantees for researchers, the organization says in a position statement sent to ScienceInsider today. But overall, “ICoRSA welcomes the initiative.”

Jankowitsch is optimistic: “We see a lot of questions, but not obstacles,” he said at ESOF. Institutes can benefit, because offering RESAVER to employees could give them a competitive hiring advantage, Jankowitsch said—but he encouraged researchers to urge their employers to join, if necessary. “If organizations are not joining, then this is not happening.”

This is an interesting idea but they should have modeled it after CERN’s pension plan which is a defined-benefit plan that thinks like a global macro fund. CERN’s former CIO, Theodore Economou is now CIO of Lombard Odier and he’s a great person to discuss this initiative with.

But before they launch RESAVER to bolster the pensions of European scientists, European policymakers and UK’s new leaders need to sit down and RESAVE the Euro.

CalSTRS Subpoenas Volkswagen for Documents Related to Emissions Cheating

CalSTRS this week served a subpoena on Volkswagen as part of the pension fund’s lawsuit against the German carmaker.

CalSTRS, which owned over $50 million of Volkswagen stock at the end of 2015, is suing the car company for shareholder losses related to the emissions scandal.

From the Financial Times:

CalSTRS, which held $52m of VW stock as of December 31, 2015, said it is looking for internal documents at Volkswagen to clarify how the carmaker came up withemissions control technology that cheated official tests.

It also seeks documents that would show how the company responded to a May 2014 study that first proved emissions were far higher than standards permitted, as well as follow-up investigations by US regulators.

“It is expected that these documents will help answer the central questions raised in the German proceedings,” CalSTRS said.

“The US Code permits discovery in support of foreign proceedings, while German law does not provide for such pre-trial discovery.”

The US Court issued an order on July 21, CalSTRS said. On Wednesday, the pension fund’s lawyers then served a subpoena to VW of America, “demanding that they deliver up the documents requested.”

CalSTRS Gains 1.4% in Fiscal 2015-16

Leo Kolivakis is a blogger, trader and independent senior pension and investment analyst. This post was originally published at Pension Pulse.

Timothy W. Martin of the Wall Street Journal reports, Giant California Teachers Pension, Calstrs, Posts Worst Result Since 2008 Crisis:

The nation’s second-largest public pension posted its slimmest returns since the 2008-2009 financial crisis because of heavy losses in stocks.

The California State Teachers’ Retirement System, or Calstrs, earned 1.4% for the fiscal year ended June 30, according to a Tuesday news release. The result is the lowest since a 25% loss in fiscal 2009 and well below Calstrs’ long-term investment target of 7.5%. Calstrs oversees retirement benefits for 896,000 teachers.

The soft returns by Calstrs, which manages $189 billion, foreshadow tough times for other U.S. pension plans as they grapple with mounting retirement obligations and years of low interest rates. On Monday the largest U.S. pension, the California Public Employees’ Retirement System, said it earned 0.6% on its investments. Other large plans are posting returns in the low single-digits.

Calstrs did report big gains in real estate and fixed income. But its holdings of U.S. and global stocks—which represent more than half of its assets—declined by 2.3%.

The fund earned 2.9% on its private-equity investments, falling short of its internal benchmark by 1.7 percentage points. Real estate rose 11.1% but lagged behind the internal target.

Calstrs investment chief Christopher Ailman said the fund’s portfolio “is designed for the long haul and “we look at performance in terms of decades, not years.”

Over the past five years, Calstrs has posted returns of 7.7%. But the gain drops to 5.6% over 10 years and 7.1% over 20 years.

John Gittelsohn of Bloomberg also reports, Calstrs Investments Gain 1.4% as Pension Fund Misses Goal:

The California State Teachers’ Retirement System, the second-largest U.S. public pension fund, earned 1.4 percent in the 12 months through June, missing its return target for the second straight year.

Calstrs seeks to earn 7.5 percent on average over time to avoid falling further behind in its obligations to 896,000 current and retired teachers and their families. The fund, which had $188.7 billion in assets as of June 30, averaged returns of 7.8 percent over the last three years, 7.7 percent over five years, 5.6 percent over 10 years and 7 percent over 20 years.

“The Calstrs portfolio is designed for the long haul,” Chief Investment Officer Christopher Ailman said Tuesday in a statement. “We look at performance in terms of decades, not years. The decade of the 2010s has so far been a good performer, averaging 10.3 percent net.”

U.S. pension funds have struggled to meet investing goals amid stock volatility, shrinking bond returns and slowing emerging-market growth at a time when retirees are living longer and health-care costs are rising. Long-term unfunded liabilities may ultimately need to be closed by higher employee withholding rates, reduced benefits or bigger taxpayer contributions.

The California Public Employees’ Retirement System, the nation’s largest pension fund with $302 billion in assets, earned 0.6 percent for the latest fiscal year, according to figures released Monday. Calpers trails its assumed annualized 7.5 percent rate of return for the past three-, five-, 10-, 15- and 20-year periods.

Calstrs and Calpers are bellwethers for public pension funds because of their size and investment approach. Both have pressured money managers to reduce fees while also using their influence as shareholders to lobby for environmental, social and corporate-governance reforms.

Calstrs returned 4.8 percent in the previous fiscal year after gaining 19 percent in 2014. Over the last decade, the teacher system’s returns ranged from a 23 percent gain in 2011 to a 25 percent loss in 2009.

Asset Allocation

The fund’s investments in stocks fell 2.3 percent last year, while fixed income and real estate both rose 11 percent and private equity increased 2.9 percent. As of June 30, Calstrs had about 55 percent of its assets in global stocks, 17 percent in fixed-income, 14 percent in real estate, 8.7 percent in private equity with the balance in cash and other financial instruments.

While Calstrs outperformed its benchmark index for equities by 0.2 percent last year, its returns trailed in every other category.

Since 2014, Calstrs’s unfunded liability has grown an estimated 27 percent to $69.2 billion while Calpers’s gap has increased 59 percent to $149 billion, according to Joe Nation, a professor of the practice of public policy at Stanford University. Both retirement systems’ assumptions of 7.5 percent returns are based on wishful thinking, he said.

“The assumption is we’re going to have a period like the 1990s again,” Nation said. “And there are very few people who believe that you’ll get the equity returns over the next five or 10 years that we saw in the 1990s.”

Of course, professor Nation is right, CalPERS, CalSTRS and pretty much all other delusional US public pensions clinging to some pension-rate-of-return fantasy are going to have to lower their investment assumptions going forward. The same goes for all pensions.

In fact, as I write my comment, Krishen Rangasamy, senior economist at the National Bank of Canada sent me his Hot Chart on US long-term inflation expectations (click on image):

While U.S. financial conditions and economic data have improved lately with consensus-topping June figures for employment, industrial output and retail spending, that’s not to say the Fed is ready to resume rate hikes. Brexit has raised downside risks to global economic growth and the FOMC will appreciate the potential spillover effects to the U.S. economy. But perhaps more concerning to the Fed is that its persistent failures to hit its inflation target ─ for four consecutive years now, the annual core PCE deflator has been stuck well below the Fed’s 2% target ─ is starting to disanchor inflation expectations.

As today’s Hot Charts show, both survey-based and market-based measures are showing sharp declines in inflation expectations. The University of Michigan survey even shows the lowest ever quarterly average for long-term inflation expectations. So, while markets are now pricing in a decent probability of a Fed interest rate hike later this year, we remain of the view that the FOMC should refrain from tightening monetary policy until at least 2017.

I agree, the Fed would be nuts to raise rates as long as global deflation remains the chief threat but some think it needs to raise rates a bit in case it needs to lower them again in the future (either way, I remain long the USD in the second half of the year).

The point I’m trying to make is with US inflation expectations falling and the 10-year Treasury note yield hovering around 1.58%, all pensions will be lucky to return 5% annualized over the next ten years, never mind 7.5%, that is a pipe dream unless of course they crank up the risk exposing their funds to significant downside risks.

Taking more risk when your unfunded liabilities are growing by 27 percent (CalSTRS) or 59 percent (CalPERS) is not a given because if markets crash, those unfunded liabilities will soar past the point of no return (think Illinois Teachers pensions).

Anyways, let’s get back to covering CalSTRS’s fiscal year results. CalSTRS put out a press release announcing its fiscal 2015-16 results:

The California State Teachers’ Retirement System remains on track for full funding by the year 2046 after announcing today that it ended the 2015-16 fiscal year on June 30, 2016 with a 1.4 percent net return. The three-year net return is 7.8 percent, and over five years, 7.7 percent net.

The overall health and stability of the fund depends on maintaining adequate contributions and achieving long-term investment goals. The CalSTRS funding plan, which was put in place in June 2014 with the passage of Assembly Bill 1469 (Bonta), remains on track to fully fund the system by 2046.

CalSTRS investment returns for the 2015-16 fiscal year came in at 1.4 percent net of fees. However, the three-and-five year performance for the defined benefit fund still surpass the 7.5 percent average return required to reach its funding goals over the next 30 years. Volatility in the equity markets and the recent June 23 U.K. referendum to exit the European Union, also known as Brexit, left CalSTRS’ $188.7 billion fund about where it started the fiscal year in July 2015.

“We expect the contribution rates enacted in AB 1469 and our long-term investment performance to keep us on course for full funding,” said CalSTRS Chief Executive Officer Jack Ehnes. “We review the fund’s progress every year through the valuation and make necessary adjustments along the way. Every five years we’ll report our progress to the Legislature, a transparency feature valuable for any such plan.”

The 2015-16 fiscal year’s investment portfolio performance marks the second consecutive year of returns below the actuarially assumed 7.5 percent. Nonetheless, CalSTRS reinforces that it is long-term performance which will make the most significant impact on the system’s funding, not short-term peaks and valleys.

CalSTRS continues to underscore and emphasize the long-term nature of pension funding as it pertains to investment performance and the need to look beyond the immediate impacts of any single year’s returns. And although meeting investment assumptions is very important to the overall funding picture, it is just one factor in keeping the plan on track. Factors such as member earnings and longevity also play important roles.

“Single-year performance and short-term shocks, such as Brexit, may catch headlines but the CalSTRS portfolio is designed for the long haul. We look at performance in terms of decades, not years,” said CalSTRS Chief Investment Officer Christopher J. Ailman. “The decade of the 2010s has so far been a good performer, averaging 10.3 percent net.”

CalSTRS’ net returns reflect the following longer-term performance:

  • 7.8 percent over three years
  • 7.7 percent over five years
  • 5.6 percent over 10 years
  • 7.1 percent over 20 years

Fiscal Year 2015–16 Returns (Net of Fees) and Performance by Asset Class (click on image):

As of June 30, 2016, the CalSTRS investment portfolio holdings were 54.8 percent in U.S. and non-U.S. stocks, or global equity; 16.9 percent in fixed income; 8.7 percent in private equity; 13.9 percent in real estate; 2.8 percent in inflation sensitive and absolute return assets; and 2.9 percent in cash.

About CalSTRS

The California State Teachers’ Retirement System, with a portfolio valued at $188.7 billion as of June 30, 2016, is the largest educator-only pension fund in the world. CalSTRS administers a hybrid retirement system, consisting of traditional defined benefit, cash balance and voluntary defined contribution plans. CalSTRS also provides disability and survivor benefits. CalSTRS serves California’s 896,000 public school educators and their families from the state’s 1,700 school districts, county offices of education and community college districts.

A few brief remarks on the results below:

  • Just like CalPERS and other large public pensions with a large asset allocation to global equities, CalSTRS has a lot of beta in its portfolio. This means when global stocks take a beating or slump, their Fund will underperform pensions with less beta in their portfolio (like CPPIB, PSP, Ontario Teachers, etc.). Conversely, when global stocks soar, they will outperform these pensions. But when stocks get hit, all pensions suffer in terms of performance (some a lot more than others).
  • Also similar to CalPERS, Private Equity had meager returns of 2.9%, underperforming its benchmark which returned 4.6%. CalPERS’s PE portfolio returned less (1.7%) but outperformed its benchmark by 253 basis points which signals “benchmark gaming” to me. You should all read Yves Smith’s comment, CalPERS Reported That It Made Less in Private Equity Than Its General Partners Did (Updated: As Did CalSTRS), to get more background and understand the key differences. One thing is for sure, my comment earlier in November 2015 on a bad omen for private equity was timely and warned all you the good days for PE are over.
  • CalSTRS’s performance in Real Estate (11.1%) significantly outperformed that of CalPERS (7.1%) but it under-performed its benchmark which returned 12.6%. Note that CalPERS  realized losses on the final disposition of legacy assets in the Opportunistic program which explains this relative underperformance.
  • More interesting, however, is how both CalPERS and CalSTRS use a real estate benchmark which reflects the opportunity cost, illiquidity and risk of the underlying investments. I’m mentioning this because private market assets at CalPERS and CalSTRS are valued as of the end of March, just like PSP and CPPIB. But you’ll recall I questioned the benchmark PSP uses to value its RE portfolio when I went over its fiscal 2016 results and this just makes my point. Again, this doesn’t take away from PSP’s outstanding results in Real Estate (14.4%) as they beat the RE benchmark CalPERS and CalSTRS use, just not by such a wide margin.
  • Fixed Income returned less at CalSTRS (5.7%) than at CalPERS (9.3%) but it uses a custom benchmark which is different from that of the latter. Still, with 17% allocated to Fixed Income, bonds helped CalSTRS buffer the hit from global equities.
  • Inflation Sensitive Assets returned 4.2% but CalSTRS doesn’t break it down to Infrastructure, Natural Resources, etc. so I can’t compare it to CalPERS’s results.
  • Absolute Return returned a pitiful 0.2%, underperforming its benchmark by 100 basis points (that benchmark is low; should be T-bills + 500 or 300 basis points). Ed Mendell wrote a comment, As CalPERS Exits Hedge Funds, CalSTRS Adds More, explaining some of the differences in their approach on hedge funds. CalSTRS basically just started investing in large global macro and quant funds and squeezes them hard on fees. The party in Hedge Fundistan is definitely over and while many investors are running for the exits, most stay loyal to them, paying outrageous fees for mediocre returns.

These points pretty much cover my thoughts on CalSTRS’s fiscal 2015-16 results. As always, you need to dig beneath the surface to understand results especially when comparing them to other pension funds.

You can read more CalSTRS press releases here including one that covers research from University of California, Berkeley which shows that for the vast majority of teachers, the California State Teachers’ Retirement System Defined Benefit pension provides a higher, more secure retirement income compared to a 401(k)-style plan. (I don’t need convincing of that but they need to significantly improve the funded status to make these pensions sustainable over the long run).

Large 401(k) Plans Don’t Use Recordkeepers’ Target Date Funds: Survey

Larger 401(k) plans are more likely to keep their recordkeeping and asset management separate, according to a study.

The report from SEI Industries Co., suggests that smaller plans are more likely to use their recordkeepers’ proprietary target-date funds.

According to Benefits Pro:

More than two-thirds of plan sponsors with more than $1 billion in plan assets are using target-date funds from a provider other than the plan’s recordkeeper, according to a survey of 231 plans with assets between $25 million and $5 billion: 47 of those plans are SEI clients.

For all plan sizes surveyed by Oaks, Pennsylvania-baed SEI, which does not have a recordkeeping business, 46 percent are using a separate asset manager’s target-date funds.

Plans in the smallest size segment are most likely to use their recordkeeper’s target-date funds. For plans with less than $100 million in assets, 68 percent use their recordkeepers’ target-date funds; about half of midsize plans with $100 million to $300 million in assets use their recordkeeper’s target-date funds; and 61 percent of large plans with assets between $300 million and $1 billion are still using their recordkeeper’s proprietary target-date funds.

Of all plan sponsors, 62 percent said it was a good idea to separate asset management services from recordkeeping. Among mega sponsors, 38 percent said sponsors should not be offering their recordkeepers’ target-date funds.

Moody’s Director: Chicago “Has Time” To Reverse Pension Debt Trajectory

A managing director for Moody’s Investors Service said that even as Chicago’s pension debt has climbed to $33.8 billion amid numerous credit downgrades, the city still has time to “reverse the trajectory of the pension problem.”

In an article in Bloomberg:

“Time is not about to run out for Chicago,” [Naomi] Richman said during a panel at the City Club of Chicago on Monday. “The city clearly doesn’t have forever, but there’s still time we think to make policy changes to avoid a full blown financial crisis.”

Chicago is not on the brink of default, according to Richman. The total of Chicago’s pensions and debt is more than nine times the city’s operating revenue, she said. That means that more than 35 cents of every dollar of the budget goes to pay debt and pensions.

[…]

Moody’s rates Chicago Ba1, one step below investment grade, and has a negative outlook. Right now, a downgrade is “much more likely” than an upgrade, Richman said. To get on track for an upgrade, the city needs to reverse “the trajectory of the pension problem,” Richman said. Last year, Mayor Rahm Emanuel pushed through a record $543 million property tax increase that will shore up public-safety pensions. Investors applauded the move and rallied the bonds. Still, it’s not enough, according to Moody’s.

Pennsylvania Auditor to Probe State Pensions for Efficiency, Transparency

Pennsylvania’s General Auditor Eugene DePasquale said on Monday he plans to conduct audits of the state’s two major public pension systems.

The audit will probe into the funds’ use of outside investment managers and the fees paid to those managers.

From PennLive:

DePasquale said it is timely now to do an independent stress test of the systems, their investment strategies, and the use of external, third-party managers to try to maximize returns.

“I have ordered this audit because we want to do everything we can to try to help with this situation,” DePasquale said Monday, noting neither fund has met its investment targets for the last year and both have significant unfunded liabilities.

“The main thing we want to answer is, are there ways they can do things better that actually saves them a lot of money, so they can put that money back into the (respective) systems,” the auditor general said.

DePasquale added that he’s not pre-judging the funds’ performance, but “obviously they’re not meeting their targets and that’s creating huge financial problems for the state.”

DePasquale said he also will examine pension forfeitures, both to make sure that law is being applied correctly, and whether Pennsylvania’s current statute should be strengthened to promote better behavior among public officials.

Italy’s Pension Funds Pressured to Fund Bank Bailout

EU stress tests are expected to show that one of Italy’s largest banks is in dire straits.

In anticipation, the Italian government is asking a group of pension funds to invest in a state-sponsored fund that would buy the bank’s bad loans.

Some reports suggest the pension funds could invest up to $550 million.

From Reuters:

Monte dei Paschi (BMPS.MI), Italy’s third-biggest bank by assets, is likely to be found short of capital under an adverse scenario when EU stress tests results are announced on Friday. A deeper financial crisis at the bank could further undermine confidence in Italy’s banking sector, the euro zone’s fourth-largest.

The chairman of ADEPP, the association of sector-specific pension funds, told Reuters that the government had asked association members to invest in the state-sponsored Atlante fund, which is working with Monte dei Paschi on the sale of 10 billion euros (£8.3 billion) in bad debts after writedowns.

“The government has made a request,” Alberto Oliveti said, adding each pension fund would decide independently after a meeting of association members later on Monday.

[…]

Under the plan, Atlante would buy the bank’s loans to borrowers deemed insolvent in a complex scheme that aims to leverage fivefold the fund’s residual resources of 1.75 billion euros, sources have said.

Atlante is ready to buy the loans at a higher price than investors specialising in buying distressed assets would offer, but that would still be below the portfolio’s net book value, blowing a hole in the bank’s account and forcing it to raise capital.

PSP Investments Gains 1% in FY 2016

Leo Kolivakis is a blogger, trader and independent senior pension and investment analyst. This post was originally published at Pension Pulse.

Rob Kozlowski of Pensions & Investments reports, PSP Investments returns 1% for fiscal year:

Public Sector Pension Investment Board, Montreal, returned 1% in the fiscal year ended March 31, a news release said.

The C$116.8 billion ($89.5 billion) pension fund exceeded its policy benchmark return of 0.3%, and its best-performing asset class was real estate at 14.4%, followed by infrastructure at 12.7%.

Natural resources returned 6.9%; private equity, 2.4%; and public markets, -3.2%.

A final asset class, private debt, was first instituted in November and thus one-year returns are not yet available.

As of March 31, the actual allocation was 58.8% public markets, 17.4% real estate, 10.7% private equity, 7.4% infrastructure, 3.1% cash and cash equivalents, 2.1% natural resources and 0.5% private debt.

PSP Investments manages the pension assets of Canadian federal public service workers, Canadian Forces, Reserve Forces and the Royal Canadian Mounted Police.

Officials at the pension fund could not be immediately reached to provide further information.

I too reached out to PSP to arrange a conversation with André Bourbonnais, PSP’s President and CEO, but they told me he “wasn’t available”. Instead a very nice lady called Anne-Marie Durand, Senior Manager, External Communications, was polite enough to respond to my email and told me she’d be happy to answer my questions via email.

Note to PSP and all other pensions: I work very hard covering your fiscal year results. The least you can do is have the decency to provide me with a short phone conversation with the CEO or CIO of your organization. I have no time to waste emailing questions to your communications people who aren’t investment officers. Moreover, some of the material may be sensitive in nature and not suitable or appropriate for email correspondence.

Now that I got that out of the way, let me get to work because there is a lot to cover. Unfortunately, the journalists are asleep this week because apart from the one article I posted above, there isn’t any coverage on PSP’s fiscal year 2016 results by the major media outlets (by the way, you can now follow PSP Investments on Twitter here @InvestPSP).

PSP Investments did put out a press release which was published on Yahoo, PSP Investments’ net assets reach $116.8 billion (added emphasis is mine):

  • One-year total portfolio return of 1% resulting in $0.9 billion of value added above the policy benchmark return
  • Five-year annualized return of 8.9% resulting in $6.4 billion of value added above the policy benchmark return
  • Ten-year annualized net return of 5.9% resulting in $7.2 billion of cumulative net investment gains over the return objective

MONTRÉAL, July 21, 2016 /CNW Telbec/ – The Public Sector Pension Investment Board (PSP Investments) announced today that its net assets under management reached $116.8 billion at the end of fiscal year 2016 (fiscal 2016), compared to $112 billion at the end of the previous fiscal year. The total portfolio generated a return of 1%, exceeding the policy benchmark return of 0.3%, and created $0.9 billion of value added.

Over the past five fiscal years, PSP Investments has recorded a compound annualized return of 8.9%, compared to 7.3% for the policy benchmark. It generated investment income of $37.3 billion, and $6.4 billion of value added above the benchmark. For the 10-year period ending March 31, 2016, PSP Investments recorded an annualized net return of 5.9%, and generated $7.2 billion of cumulative net investment gains over the return objective.

“In a year characterized by high volatility and negative returns in most markets and by significant changes internally, our team has been able to provide a positive performance, both in absolute terms and against our policy benchmark return,” said André Bourbonnais, President and Chief Executive Officer of PSP Investments. “Most of our private market asset classes, and more particularly real estate, recorded strong returns during the year and surpassed their respective benchmarks. However, public equity markets posted negative returns and private equity underperformed. Our overall performance suffered as a result. After five consecutive years of positive, often double-digit returns, PSP Investments continues to exceed our long-term real return objective of 4.1%, thereby contributing to the long-term sustainability of the public sector pension plans whose assets we invest in order to provide financial protection for those who dedicate their lives to public service,” Mr. Bourbonnais added.

Corporate highlights and strategic initiatives

Fiscal 2016 was a year of significant change for PSP Investments. After assuming his position as President and CEO at the end of fiscal 2015, André Bourbonnais immediately undertook a broadly-based strategic review,” said Michael P. Mueller, Chair of the Board. “That review is having a transformational effect. It has resulted in a new direction and a shift in organizational responsibilities, as well as in investment, operational and compensation models. PSP Investments is becoming a more cohesive organization with an increased capacity to deliver on its mission and mandate.”

Among the strategic initiatives undertaken in fiscal 2016, the position of Chief Investment Officer was enhanced with responsibility for implementing a total portfolio approach and evolving the portfolio construction framework by pursuing cross-functional investments with an efficient mix of asset classes.

Private debt, which focuses on principal debt and credit investments in primary and secondary markets worldwide, was introduced as a new asset class in November 2015. It is a long-term asset class that offers attractive premiums on underlying illiquidity.

Although it remains committed to Canada, PSP Investments is expanding its global footprint. It opened an office in New York where the private debt market is centred. It is developing London as a European hub to pursue private investment and private debt opportunities.

“Our strategic efforts reflect considered, deliberate choices, and were undertaken with a view to enhance the construction of our portfolio,” said André Bourbonnais. “The impact of these strategic changes will not be felt overnight, but they are consistent with our long-term perspective. Our vision is to be a leading global institutional investor that reliably delivers on its risk-return objective by focusing on a total fund perspective. We seek opportunities to invest innovatively at scale. Our investment approach is to leverage select business-to-business relationships and gain local market insights to identify deployment opportunities. The positive returns we generated in many asset classes during fiscal 2016 result from the ongoing implementation of this strategy.”

Portfolio highlights by asset class

PSP Investments’ net assets increased by $4.8 billion in fiscal 2016. Gains are attributable to net contributions of $4.0 billion and comprehensive income of $0.8 billion. Strong returns in Real Estate, Infrastructure and Natural Resources were partially offset by lower returns in Private Equity and negative returns in Public Markets.

Public Markets

  • At March 31, 2016, Public Markets had net assets of $68.6 billion, compared to $76.3 billion at the end of fiscal 2015. In fiscal 2016, Public Markets recorded investment income of negative $2.5 billion, for an overall return of negative 3.2%, compared to a benchmark return of negative 2.3%. Most of Public Markets strategies performed above their respective benchmark, but the Value Opportunity Portfolio had a fairly significant negative impact on Public Markets’ performance. Over a five-year period, Public Markets has generated an annualized return of 7.9%, compared to a benchmark return of 7.5%.

Real Estate

  • At March 31, 2016, Real Estate had net assets of $20.4 billion, an increase of $6.0 billion from the previous fiscal year. Direct ownership and co-investments accounted for 88% of Real Estate assets, an increase from 86% at the end of fiscal 2015.
  • In fiscal 2016, Real Estate generated investment income of $2.3 billion, for a total return of 14.4%, compared to a benchmark of 5.1%. Over a five-year period, Real Estate investments produced an annualized return of 12.9%, compared to a benchmark return of 5.5%.
  • In fiscal 2016, Real Estate deployed $3.5 billion in new investments broadly diversified across geographies and sectors, and had unfunded commitments of $1.5 billion for investments closed during the year.

Private Equity

  • As at March 31, 2016, Private Equity had net assets of $12.5 billion, an increase of $2.4 billion from the previous fiscal year. Direct investments and co-investments accounted for 40% of the assets in the Private Equity portfolio, in line with fiscal 2015.
  • In fiscal 2016, Private Equity generated investment income of $279 million, for a return of 2.4%, compared to a benchmark return of 8.9%. The portfolio generated distributions of more than $1.0 billion during the year, from realized capital gains, interest and dividends. Portfolio income was primarily generated by investments in funds, including targeted funds of funds portfolio, and by gains in certain direct holdings. However, overall portfolio performance was offset by positions primarily in the communications and energy sectors, which were impacted by macro-economic factors, resulting in lower valuation multiples for many investments. Over a five-year period, Private Equity investments generated an annualized return of 11.1%, compared to a benchmark return of 11.2%.
  • In fiscal 2016, Private Equity committed a total of $2.7 billion to funds with existing and new partners, and completed new direct investments and co-investments of $1.2 billion, including the acquisition of AmWINS Group, a leader in the wholesale insurance industry in the United States, and of Homeplus, one of South Korea’s largest multi-channel retailers, in a deal led by fund partner MBK Partners.

Infrastructure

  • As at March 31, 2016, Infrastructure had net assets of $8.7 billion, an increase of $1.6 billion from the previous fiscal year. Direct investments accounted for 86% of the assets in the Infrastructure portfolio, up slightly from 85% at the end of fiscal 2015.
  • In fiscal 2016, the Infrastructure portfolio generated investment income of $940 million, for a return of 12.7%, compared to a benchmark return of 5.5%. The portfolio return was driven mainly by direct investments in the transportation and utilities sectors in Europe and emerging markets. Over a five-year period, Infrastructure investments generated an annualized return of 9.6%, compared to a benchmark return of 6.5%.
  • In fiscal 2016, Infrastructure acquired a participation in Allegheny Hydro, LLC, and reinvested in Angel Trains Limited, Cubico Sustainable Investments Limited and AviAlliance GmbH. It also committed to an agreement to acquire a New England portfolio of hydroelectric assets from ENGIE Group for an enterprise value of US$1.2 billion.

Natural Resources

  • As at March 31, 2016, Natural Resources had net assets of $2.5 billion, an increase of $1.0 billion from the previous fiscal year. Direct investments accounted for 96% of Natural Resources assets.
  • In fiscal 2016, Natural Resources generated investment income of $150 million, for an overall return of 6.9%, compared to a benchmark return of 5.1%. Portfolio returns were primarily driven by investments in timber and agriculture, which generated a return of 20.5%. Valuation gains were materially offset by markdowns in oil and gas investments. Since its inception in June 2011, Natural Resources has generated an annualized return of 11.1%, compared to a benchmark return of 4.5%.
  • In agriculture, Natural Resources continued to expand and add to the number of investment platforms in which it participates alongside high quality, like-minded operators in some of the world’s lowest cost regions, including Australasia, North America and South America.

Private Debt

  • Private Debt was approved by the Board of Directors as an asset class in November 2015. It focuses on principal debt and credit investments, in primary and secondary markets worldwide. Private Debt’s priority is to provide credit capital to non-investment grade US and European corporate borrowers. It has a target allocation of 5% of PSP Investments’ assets under management. At March 31, 2016, Private Debt had funded net assets of $640 million across six direct investment transactions.
  • In fiscal 2016, Private Debt generated net investment income of $1.4 million, resulting in a rate of return of 3.0%, compared to a benchmark return of negative 3.9%. Portfolio returns were driven by upfront fees, coupon interest, valuation adjustments and foreign exchange gains and losses. The return of the asset class was negatively impacted by the fluctuation in the Canadian dollar, resulting in significant foreign exchange losses for the year. The rate of return in local currency (US dollars) amounted to 9.1% for the year.
  • In fiscal 2016, Private Debt committed to a total of US$2.3 billion, including a significant financing commitment alongside partner Apollo Global Management, LLC, to participate in the take private transaction of The ADT Corporation, a leading home and business security monitoring company.

For more information about PSP Investments’ fiscal year 2016 performance or to view PSP Investments’ 2016 Annual Report, visit investpsp.com.

About PSP Investments

The Public Sector Pension Investment Board (PSP Investments) is one of Canada’s largest pension investment managers with $116.8 billion of net assets under management as at March 31, 2016. It manages a diversified global portfolio composed of investments in public financial markets, private equity, real estate, infrastructure, natural resources and private debt. Established in 1999, PSP Investments manages net contributions to the pension funds of the federal Public Service, the Canadian Armed Forces, the Royal Canadian Mounted Police and the Reserve Force. Headquartered in Ottawa, PSP Investments has its principal business office in Montréal and offices in New York and London. For more information, visit investpsp.com or follow Twitter @InvestPSP.

Since when did PSP’s website become investpsp.com and not investpsp.ca? Both websites work but I guess given the “global focus” dot.com is more appropriate.

Anyways, let’s get on with analyzing PSP’s fiscal 2016 results but before we do, please take the time to read the Chair’s Report (page 12), the President’s Report (page 14) and the interview with PSP’s CIO, Daniel Garant, on “One PSP” on page 23 of  PSP’s 2016 Annual Report.

The complete 2016 Annual Report is available here and in my opinion, it’s excellent and well worth reading all of it which I did yesterday. But if you can’t read it all, at least read the passages I mentioned because it’s important to note, this isn’t Gordon Fyfe’s PSP, it’s clearly André Bourbonnais’s PSP, and there are important strategic and cultural shifts going on at this organization.

Of course, as you will read below, there are some benchmark legacies from the Gordon Fyfe/ André Collin/ Derek Murphy/ Bruno Guilmette days that still linger at PSP (the players change but gaming benchmarks goes on unabated, especially in Real Estate).

Actually, since I’m a stickler for benchmarks, let’s begin with PSP’s benchmarks which can be found on page 36 of the 2016 Annual Report (click on image):

As you can see, the benchmarks for Public Markets are pretty straightforward and widely recognized in the industry. However, when it comes to Private Markets, things become a lot less clear.

Private Equity has a benchmark which reflects the Private Equity Universe (plus the cost of capital), which is fine, but Real Estate, Infrastructure, and Natural Resources all have “custom benchmarks” which reflect their cost of capital, and this is far from fine.

Why are benchmarks critical? Because benchmarks are how you calculate the value-added of an investment portfolio which determines compensation of senior investment officers. And if the benchmarks don’t reflect the risks, opportunity cost and illiquidity of the underlying portfolio, pension fund managers can easily game their benchmark to their advantage.

Let me show you what I mean. Below, I embed the PSP’s portfolio and benchmark returns which can be found on page 37 of the 2016 Annual Report (click on image):

As you can see, PSP Investments reports portfolio returns vs benchmark returns for fiscal year 2016 and the annualized portfolio returns vs benchmark returns for the last five fiscal years.

This is great, every pension fund should report this along with a clear and in-depth discussion on the benchmarks they use to gauge value added in public and private markets.

Now, notice the huge outperformance of the Real Estate portfolio in fiscal 2016 (14.4% vs 5.1% benchmark return) and over the last five fiscal years (12.9% vs 5.5% benchmark return)?

The same goes for the Infrastructure portfolio. In fiscal 2016, it returned 12.7% vs 5.5% for its benchmark and over the last five fiscal years, it returned an annualized rate of 9.6% vs 6.5% for the benchmark (over a longer period, the benchmark for Infrastructure seems appropriate).

So what’s the problem? The problem is these two asset classes make up a quarter of PSP’s asset mix and when I see such outperformance over their respective benchmark over one or five fiscal years (especially in Real Estate), it immediately signals to me that the benchmark doesn’t reflect the risks of the underlying portfolio.

Not only this, PSP’s Real Estate has accounted for the bulk of the value-added since its inception (both in dollar and percentage terms), and this has helped senior officers at PSP collect multi millions in compensation.

Now, for comparison purposes, I looked again at my comment on CPPIB’s fiscal 2016 results. PSP and CPPIB are similar pension funds in many ways except the latter is much bigger. But they both have fiscal years that end on March 31st and their asset mix and liquidity profile are similar.

So why did CPPIB gain 3.4% in fiscal 2016 and PSP only 1%? A big factor behind this relative outperformance is that CPPIB doesn’t hedge currency risk whereas PSP is 50% hedged, so the former enjoyed currency gains across the public and private market investments (PSP is reviewing its currency hedging policy and will likely move to no hedging like CPPIB).

But it’s not just currency gains, CPPIB had a stellar year and really fired on all cylinders across all its investment portfolios. The overall results don’t reflect this but if you dig deeper and analyze the results properly, you will see this.

CPPIB’s Real Estate and Infrastructure portfolios also enjoyed great performances in fiscal 2016, returning 12.3% and 9.3% respectively (click on image):

Notice, however, that CPPIB doesn’t report the same way as PSP, namely, portfolio returns over one and five fiscal years relative to benchmark returns.

This is because CPPIB has one of the toughest Reference (benchmark) Portfolios in the industry (CPPIB provides an in-depth discussion on risk and how they benchmark investment activities and they do consider opportunity cost and illiquidity). It has an elaborate and detailed way to measure risk of each investment but I wish it did report the same way as PSP because then I can show you the outperformance (or value-added) over benchmark at CPPIB is considerably less over one and five fiscal years for Real Estate (Yes, PSP returned more in RE but a bigger reason is the benchmark used in RE is alot easier to beat at PSP).

I’ve discussed PSP’s private market benchmark issues before (see last year’s comment) and I want to make it clear, I have nothing against PSP’s Real Estate team. Neil Cunningham is a great guy and he and his team are delivering outstanding results but if I was sitting on the Board of PSP, they wouldn’t be getting away with this benchmark (Note: Even with a tougher benchmark, they would still outperform with these type of returns).

Anyways, all this discussion on benchmarks and outperformance leads me to compensation. I highly suggest you read the entire Compensation section which begins on page 72 of the 2016 Annual Report. Below, I embed the summary compensation table (along with footnotes) which can be found on page page 79 (click on image):

A few brief remarks on compensation

  • The compensation is fair and in line with short-term and mostly long-term performance. Sure, the senior investment officers at PSP get paid extremely well, especially by Montreal standards, but given the size of the fund and the investment activities across public and private markets that require specialized skill sets and given what other large Canadian pensions pay their senior investment officers, it’s not outrageous.
  • What I find outrageous are the lavish severance packages. When I read how much former officers Bruno Guilmette and John Valentini earned, I almost fell off my chair. The amount includes a severance package which is clearly outlined in the previous annual report but still, these are huge packages. At least Bruno was a senior investment officer (“alpha generator”) but John was an interim CEO for nine months before André Bourbonnais was appointed CEO so that factored into his compensation (no worries, he landed on his feet quickly at Fiera Capital).
  • Noticeably absent from these former officers is Derek Murphy, PSP’s former head of Private Equity. He left the organization soon after Bourbonnais took over the helm (either he quit or settled but his name doesn’t appear in the table above). He is now running a PE firm in Montreal called Aquaforte which helps institutional investors get a better alignment of interest with general partners (GPs).

And the points below on the new incentive plan are taken from the 2016 Annual Report:

  • It was agreed that the incentive compensation framework should be less formulaic and produce less volatility in year-to-year payouts while allowing management and the Board to differentiate rewards based on components which go beyond investment performance alone. An overriding goal was to shift investment performance measurement from purely relative,
    medium-term metrics to long-term absolute, total fund results. Another goal was to encourage more cooperation across the organization, again aligning individual success with the total fund, not just its component parts. This is a key element of One PSP. It was also decided that senior management should have a larger proportion of its compensation deferred and performance conditioned.
  • The new incentive compensation plan will be driven  by two key elements: 1) an annual overall assessment of PSP Investment’s performance based on a mix  of relative (five-year) and absolute (seven-year) total fund investment performance, as well as five-year relative investment performance for individual asset classes, and the achievement of business units’ respective annual objectives derived from PSP Investments’ five-year business strategy, and 2) an annual assessment of personal objectives.

Lastly, let me end this comment with some positive feedback:

  • First, as I stated, you should all take the time to read the entire 2016 Annual Report, especially the Chair and President’s report, as well as the interview with the CIO on “One PSP”. The Annual Report is excellent and provides a lot of details I cannot go over here.
  • Second, there is no question that André Bourbonnais is trying to steer the ship toward a new and solid direction. He and his senior team have laid out a detailed strategic plan which includes cultivating One PSP, improving the brand locally and internationally, increasing the global footprint, creating scalable and efficient investment and operational activities, and developing their talent.
  • Third, in my opinion, enhancing the role of the CIO with responsibility for implementing a total portfolio approach and evolving the portfolio construction framework by pursuing cross-functional investments with an efficient mix of asset classes is critical and very smart.
  • Fourth, I was happy to see PSP is finally taking an initiative on diversity in the workplace, just like CPPIB is doing. I’m a big believer in diversity in the workplace at all levels of the organization and think that PSP, CPPIB and all of Canada’s Top Ten pensions have a lot of work to do on this front not just by promoting women and offering them equal pay but also by promoting visible minorities and incorporating other disadvantaged minorities like aboriginals and especially people with disabilities (Note to PSP: You should ask candidates to self-identify when they apply for jobs and have specific programs targeting minorities. All Canadian pension funds should follow the Royal Bank’s model and significantly improve on it).
  • Fifth, the introduction of private debt as an asset class makes a lot of sense. You should all read a paper by professor Amin Rajan, The Rise of Private Debt as an Institutional Asset Class, to understand what private debt is all about and why PSP is perfectly placed to take advantage of this asset class.
  • Sixth, I’m glad PSP is on Twitter and communicating a lot more about its investment activities (they should add a dedicated YouTube channel). You can find the latest articles on PSP here, including one that discusses the hire of Oliver Duff as managing director of principal debt and credit investments (Europe), to lead a European private debt push.

That is all from me, I am literally pooped and want to go out to enjoy the summer weather. Before I do, I want to wish you a great weekend and publicly thank the few who support this blog via your donations and subscriptions.

As for Mr. Bourbonnais and the rest of PSP, I wish you a lot of success and even though the new shift will have some bumps along the way, I’m confident the Fund and its beneficiaries and contributors will be better off in the long run.

CalPERS Smears Lipstick on a Pig?

Leo Kolivakis is a blogger, trader and independent senior pension and investment analyst. This post was originally published at Pension Pulse.

Timothy W. Martin of the Wall Street Journal reports, Calpers Reports Lowest Investment Gain Since Financial Crisis:

The largest U.S. public pension posted its lowest annual gain since the last financial crisis due to heavy losses in stocks.

The California Public Employees’ Retirement System, or Calpers, said it earned 0.6% on its investments for the fiscal year ended June 30, according to a Monday news release.

It was the second straight year Calpers failed to hit its internal investment target of 7.5%. Workers or local governments often must contribute more when pension funds fail to generate expected returns. Calpers oversees retirement benefits for 1.7 million public-sector workers.

Calpers’ annual results are watched closely in the investment world. It is considered a bellwether for U.S. public pensions because of its size and investment approach. Many pensions currently are struggling because of a sustained period of low interest rates.

“This is a challenging time to invest,” Ted Eliopoulos, Calpers’ chief investment officer, said in the release.

The last time Calpers lost money was during fiscal 2009 when the fund’s holdings fell 24.8%.

The giant California plan ended 2016 with roughly $295 billion in assets, and more than half of those funds are invested with publicly traded stocks. Those investments declined 3.4%, though the performance beat internal targets.

Fixed income produced the largest returns at 9.3%, though the results under performed Calpers’ benchmark. The California retirement giant’s private-equity portfolio posted returns of 1.7%.

Real estate holdings returned 7.1%, but that was below Calpers’ internal target by more than 5.6 percentage points.

Rory Carroll of Reuters also reports, CalPERS reports worst year since 2009 amid market volatility:

California’s largest public pension fund posted a 0.61 percent return on investment in its most recent fiscal year, its worst showing since 2009, which it blamed on global market volatility.

The result marked the second straight year the California Public Employees’ Retirement System or CalPERS failed to meet its assumed investment return of 7.5 percent.

If the $302 billion public pension fund consistently misses the 7.5 percent target, state taxpayers could be forced to make up any shortfall in pension funding.

Last fiscal year, CalPERS returned 2.4 percent on its total portfolio, marking a significant decline from previous years when the fund earned double digit returns of more than 10 percent. The result for the year ending June 2016 was the worst since an investment loss of 23.6 percent in 2009.

The yearly rates of return, once audited, help determine contribution levels for state agency employers and for contracting cities, counties and special districts in fiscal year 2016-2017.

Speaking at a CalPERS meeting, Chief Investment Officer Ted Eliopoulos said performance for the year was driven primarily by global equity markets, which represent a little over half of the fund’s portfolio. Equities delivered a return of negative 3.4 percent.

“When 52 percent of your portfolio is achieving a negative 3.4 percent return, that certainly sets the main driver for the overall performance of the fund,” said Eliopoulos, who had projected flat returns for the year in June.

Inflation assets returned a negative 3.6 percent return, helping drag down the fund’s overall performance, Eliopoulos said.

Fixed income and real estate investments were bright spots in the portfolio, posting 9.3 percent and 7.1 percent returns respectively.

In response to the drop from previous years, Eliopoulos said CalPERS would reduce risk from its portfolio and have simpler investments that do not require paying fees to money managers.

Fund officials, recognizing that the wave of retiring baby boomers means it will pay out more in benefits than it takes in from contributions and investment income, have projected that the fund could have negative cash flow for at least the next 15 years.

You can read more articles on CalPERS’s fiscal 2015-2016 results here. CalPERS’s comprehensive annual report for the fiscal year ending June 30, 2015 is not yet available but you can view last year’s fiscal year annual report here.

I must admit I don’t track US public pension funds as closely as Canadian ones but let me provide you with my insights on CalPERS’s fiscal year results:

  • First, the results aren’t that bad given that CalPERS’s fiscal year ends at the end of June and global equity markets have been very volatile and weak. Ted Eliopoulos, CalPERS’s CIO, is absolutely right: “When 52 percent of your portfolio is achieving a negative 3.4 percent return, that certainly sets the main driver for the overall performance of the fund.” In my last comment covering why bcIMC posted slightly negative returns during its fiscal 2016, I said the same thing, when 50% of the portfolio is in global equities which are getting clobbered during the fiscal year, it’s impossible to post solid gains (however, stocks did bounce back in Q2).
  • Eliopoulos is also right, CalPERS and the entire pension community better prepare for lower returns and a lot more volatility ahead. I’ve been warning about deflation and how it will roil pensions for a very long time. 
  • As far as investment assumptions, all US public pensions are delusional. Period. CalPERS and everyone else needs to lower them to a much more realistic level. Forget 8% or 7%, in a deflationary world, you’ll be lucky to deliver 5% or 6% annualized gains over the next ten years. CalPERS, the government of California and public sector unions need to all sit down and get real on investment assumptions or face the wrath of a brutal market which will force them to cut their investment assumptions or face insolvency. They should also introduce risk-sharing in their plans so that all stakeholders share the risks of the plan equally and spare California taxpayers the need to bail them out.
  • What about hedge funds? Did CalPERS make a huge mistake nuking its hedge fund program two years ago? Absolutely not. That program wasn’t run properly and the fees they were doling out for mediocre returns were insane. Besides, the party in hedge funds is over. Most pensions are rightly shifting their attention to infrastructure in order to meet their long dated liabilities. 
  • As far as portfolio returns, good old bonds and infrastructure saved them, both returning 9% during the fiscal year ending June 30, 2016. In a deflationary world, you better have enough bonds to absorb the shocks along the way. And I will tell you something else, I expect the Healthcare of Ontario Pension Plan and the Ontario Teachers’ Pension Plan to deliver solid returns this year because they both understand liability driven investments extremely well and allocate a good chunk into fixed income (HOOPP more than OTPP).
  • I wasn’t impressed with the returns in CalPERS’s Real Estate portfolio or Private Equity portfolio (Note: Returns in these asset classes are as of end of March and will end up being a bit better as equities bounced back in Q2). The former generated a 7.06 percent return, underperforming its benchmark by 557 basis points and suffered relative underperformance in the non-core programs, including realized losses on the final disposition of legacy assets in the Opportunistic program. CalPERS Private Equity program bested its benchmark by 253 basis points, earning 1.70 percent, but that tells me returns in this asset class are very weak and the benchmark they use to evaluate their PE program isn’t good (they keep changing it to make it easier to beat it). So I’m a little surprised that CalPERS new CEO Marcie Frost is eyeing to boost private equity.

In a nutshell, those are my thoughts on CalPERS fiscal 2015-16 results. Is CalPERS smearing lipstick on a pig? No, the market gives them and everyone else what the market gives and unless they’re willing to take huge risks, they need to prepare for lower returns ahead.

But CalPERS and its stakeholders also need to get real in terms of investment projections going forward and they better have this conversation sooner rather than later or risk facing the wrath of the bond market (remember, CalPERS is a mature plan with negative cash flows and as interest rates decline, their liabilities skyrocket).

Hope you enjoyed reading this comment, please remember to kindly donate or subscribe to this blog on the right-hand side to show your support and appreciation for the insights I provide you.

bcIMC Dips 0.2% in Fiscal 2016

Leo Kolivakis is a blogger, trader and independent senior pension and investment analyst. This post was originally published at Pension Pulse.

Canada News Wire reports, bcIMC Reports Fiscal 2016 Annual Returns:

British Columbia Investment Management Corporation (bcIMC) today announced an annual combined pension return, net of costs, of -0.2 per cent for the fiscal year ended March 31, 2016, versus a combined market benchmark of -0.3 per cent.

Fiscal 2016 was a challenging year for investors. However, within a low return environment, our investment activities generated $133 million in additional value for our pension plan clients, driven by strong performance in private markets and real estate. Relative outperformance within the public equity markets, especially Canadian equities and emerging markets, as well as outperformance within our mortgages program, also contributed to investment returns.

“On behalf of our clients, bcIMC manages a diverse and quality portfolio of assets and we follow an investment discipline that focuses on the long term,” said Gordon J. Fyfe, bcIMC’s Chief Executive Officer and Chief Investment Officer. “Maintaining our discipline allows us to manage market risks during periods of volatility so our investments can provide stable cash flows and will appreciate in value over time.”

As a long-term investor, bcIMC’s mandate is to invest the funds not currently required by our clients to pay pensions and other benefits. On average, $75 of every $100 a pension plan member receives is due to our investment activities.

In fiscal 2016, we continued to build relationships globally, expanded our investment products and assessed investment opportunities that align with our clients’ long-term, risk and return objectives.

Fiscal 2016 Investment Highlights

  • Committed $2.6 billion in new capital in our Private Equities program, of which $730 million was in direct investments.
  • Deployed approximately $1.1 billion in direct investments in infrastructure.
  • Committed $1.1 billion through the mortgage program to commercial real estate across Canada.
  • Awarded an additional US$200 million China-A share quota from China regulators so we have the opportunity to invest in the region’s new service economy.
  • Completed two Real Estate developments (745 Thurlow and Northwoods) and currently have 26 properties in various stages of progress across Canada

“Our investment professionals generated additional value for our clients in a low return environment. They are making the strategic investment decisions that enable us to continue to grow our clients’ long-term wealth, while also protecting the value of their funds,” added Fyfe.

For the year, bcIMC’s managed net assets were $121.9 billion. As at March 31, 2016, the asset mix was as follows: Public Equities (47.5% or $57.9 billion); Fixed Income (21.4% or $26.3 billion); Real Estate (14.4% or $17.5 billion); Infrastructure (5.9% or $7.1 billion); Private Equities (5.6% or $6.8 billion); Mortgages (2.3% or $2.8 billion); Other Strategies—All Weather (1.5% or $1.8 billion); Renewable Resources (1.4% or $1.7 billion). For more information, bcIMC’s 2015–2016 Annual Report is available on our website at www.bcimc.com.

About bcIMC

With $121.9 billion of managed net assets, the British Columbia Investment Management Corporation (bcIMC) is one of Canada’s largest institutional investors within the global capital markets. We offer our public sector clients responsible investment programs across a range of asset classes: fixed income; mortgages; public and private equity; real estate; infrastructure; renewable resources. Our investments provide the returns that secure our clients’ future payments and obligations.

The article above is bcIMC’s official press release available here. Those of you who want to delve deeper into fiscal 2016 results can do so by reading the Annual Report which is available here.

I didn’t find any press coverage of bcIMC’s fiscal 2016 results in major news outlets (either journalists are asleep or bcIMC isn’t reaching out to them) but someone in Ottawa sent me a short article from Richard Dettman of News1130, BC pension fund posts no gain for 2015-16:

BC’s giant public-sector pension fund manager is reporting its first decrease since the financial crisis. The BC Investment Management Corporation says its assets under management in the year to the end of March were down $1.7 billion to $123.6 billion. Its biggest losing bet was on emerging markets, followed by Canadian stocks.

The BC fund underperformed its peers, such as Quebec’s Caisse de depot which returned 9.1 per cent last year and the Ontario Teachers’ Pension Plan which made 13 per cent. The four-year average return by bcIMC is 9.4 per cent.

CEO and chief investment officer Gordon Fyfe says bcIMC “plans to increase client returns by bringing more asset management in-house,” specifically its “private markets and public equities,” rather than using outside firms.

Canada’s fifth-largest pension fund says it is “rebuilding its base,” hiring 76 new people and reviewing compensation “to attract and retain skilled professionals.”

When Gordon Fyfe left PSP to head bcIMC two years ago, I stated he was going to focus on private markets and hire some people away from PSP.

One major hire from PSP is Jim Pittman who joined bcIMC in April of this year to head bcIMC’s Private Equity group (scroll over “Private Equity” on bcIMC’s organization chart). This is an excellent hire and I have nothing but good things to say about Jim who I’m confident will do a great job building out direct and fund investments at bcIMC.

[Note: The former head of Private Equity at PSP, Derek Murphy, started a private equity firm based here in Montreal called Aquaforte which assists Limited Partners (LPs) to establish aligned, high-performing, private equity partnerships with General Partners (GPs). I’m pretty sure he’s helping Jim set up shop at bcIMC.]

The other major and recent change at bcIMC is the creation of a subsidiary to manage real estate assets in-house. Gary Marr of the Financial Post reports, B.C. pension fund creates giant, multi-billion-dollar real estate company:

The Canadian commercial real estate industry will soon face a new multi-billion-dollar competitor in the marketplace.

British Columbia Investment Management Corp. said Wednesday it will take its $18 billion in real estate assets under management and create a new private company, to be called QuadReal Property Group, which will look to expand in Canada and globally.

BcIMC, which provides investment management services to the province’s public sector and invests the funds not currently required to pay pensions and other benefits, will set QuadReal up with an independent board of directors to oversee its operation.

As part of the move to internalize management of its real estate operations, the new company has retained Remco Daal as its co-president to head up its Canadian operations. Daal was the president of Bentall Kennedy, one of the companies that was providing external management to the B.C. pension fund.

The majority of bcIMC’s Canadian real estate assets are currently managed externally by Bentall, GWL Realty Advisors and Realstar. Management of real estate assets from those companies will begin to transfer to QuadReal in 2017. Roughly 500 employees are coming over from Bentall Kennedy to join the new entity.

“They’ve had a great run under the existing model and they are moving to more of a Canadian model as to how they manage their real estate,” said Daal, referring to the internalization of real estate, which is common for other major domestic players like the Ontario Municipal Employees Retirement System and Caisse de dépôt et placement du Québec.

With assets of $123 billion, 14 per cent of which is allocated to real estate, QuadReal expects to be saving money on fees as it begins to expand its base. Real estate allocation is slated to rise 18 per cent and bcIMC total assets will rise to about $150 billion in the next four years.

“We expect there will be assets for which we compete and opportunities for tenants which we compete,” said Daal, referring to the asset managers they are now dropping. “It’s all fair game.”

Last year, bcIMC started studying the internalization and brought in Jonathan Dubois-Phillips to look at that possibility. He will act as co-president and run QuadReal’s international operations.

The new company has no specific type of asset class in real estate it is eyeing and says it will be market driven. There is clearly no appetite to sell Canadian assets, which include Bayview Village, the luxury mall in north Toronto.

“The domestic portfolio is of a quality that we can’t replicate. The income stream is solid, solid and that’s ultimately what what our clients want,” Daal said.

While there may be no appetite to sell Canadian assets, the truth is bcIMC’s Real Estate portfolio is almost entirely invested in domestic real estate, something which has hurt the fund’s overall returns relative to its larger peers which are more diversified across global real estate (in other words, bcIMC cannot benefit from capital appreciation and currency appreciation which comes from investing in foreign real estate assets, especially if it doesn’t hedge currency risk).

Now, this brings me to an important point, it’s not exactly fair to compare bcIMC’s fiscal year 2016 results to those of its other large Canadian peers because apart from the different fiscal year, bcIMC is expanding its investments in private markets and bringing these assets internally. It will take a few more years for bcIMC  to shift from a plain vanilla fund to one that is more diversified across global public and private asset classes.

Having said this, the fiscal year 2016 results and value-added are nothing to write home about but over a four-year period, which is what compensation is based on, the results are better (click on image):

And if you look at the returns by asset class for the combined pension plan clients (page 16 of Annual Report), they’re actually quite decent across public and private assets (click on image):

The big returns came from Private Equities, Infrastructure and Real Estate but Canadian and Emerging Market public equities outperformed their respective benchmarks even if they were negative returns. The Bridgewater All-Weather portfolio also added value (see my last comment).

Keep in mind, however, as of now, nearly 50% of bcIMC’s assets are in Public Equities, so no matter how well Private Markets perform, if global stocks get clobbered during the fiscal year, it will impact overall returns (click on image):

One thing I found odd in the fiscal 2016 Annual Report is that I couldn’t find a discussion on the benchmarks used for each asset class. I’m a stickler for benchmarks because that determines value-added, compensation and risk-taking behavior at Canada’s large pension funds.

The only mention of benchmarks I saw was on page 14 where they show index returns for the fiscal year (click on image):

But there is no discussion on private market benchmarks (if someone knows where I can find a discussion on bcIMC’s benchmarks, please let me know).

As far as compensation, the table below from page 37 of the Annual Report provides a summary of compensation of bcIMC’s senior managers (click on image):

Gordon Fyfe’s compensation increased the most on a percentage and absolute basis but is significantly below what he was making at PSP. As far as the other senior managers, their compensation increased marginally and is way below what their peers in the rest of Canada earn.

Again, when looking at compensation, keep in mind it’s four-year results that count and bcIMC’s asset mix is still heavily weighted in public equities, which partly explains the variation in the compensation of its senior managers relative to their peers at other large Canadian public pension funds (still, they are top earners in British Columbia’s public sector, so I don’t feel bad for them).

To summarize, bcIMC’s fiscal 2016 results aren’t great but they’re not that bad either given its asset mix is still heavily weighted in public equities. You can read all recent news pertaining to bcIMC here including their recent acquisition of a 10% stake in Glencore Agri (CPPIB owns a 40% stake).


Deprecated: Function get_magic_quotes_gpc() is deprecated in /home/mhuddelson/public_html/pension360.org/wp-includes/formatting.php on line 3712