 Are affluent households worrying about having enough money to last through retirement? According to a survey from Bank of America, the short answer is “yes” – in fact, it’s one of their biggest concerns.
Bank of America polled 1,000 “affluent” people with investable assets of between $50,000 and $250,000. The results were published in the October issue of Pension Benefits:
“More than half (55%) of the mass affluent (defined as individuals with $50,000 to $250,000 in total household investable assets) fear going broke during retirement-far more common than other stress-inducing pressures such as losing their job (37%).
More women than men (59% versus 51%) are frightened about the possibility of not having enough money throughout retirement, and the fear of an uncertain retirement is also most common among 61% of Gen Xers (aged 35 to 50) and 61% of Boomers (aged 51 to 64). Only 41% of Millennials (aged 18 to 34) feel this way.
Despite their fears about future finances, many mass affluent won’t consider cutting back on indulgences today to save for retirement-from entertainment (33%) to eating out (30%) to vacations (28%).
Even if they were faced with a hypothetical milliondollar windfall, fewer than one in five (19%) would make it a priority to set aside the ‘found money’ for their retirement years.
More Boomers (27%) than Gen Xers (16%) and Millennials (6%) would first consider allocating a million-dollar lottery prize to their retirement funds.
Additionally, the most common factors competing with respondents’ regular retirement savings are unexpected costs (33%) and paying off big debts (31%). Paying off large debts (such as student loans) has competed with the retirement savings of more Millennials (38%) than any other generation.
On average, retired respondents stopped working at age 68; however, those who have not retired plan to at age 65. Single mass affluents, on average, plan to retire or have retired at age 62. More than two in five (41%) mass affluents who have not retired yet imagine that they’ll need an annual income somewhere in the $50,000 to $99,999 range when they retire.
About a quarter of Millennials (24%) and Gen Xers (25%) believe they’ll need at least $150,000 annually when they retire-far more than Boomers, with just 11% believing they’ll need that much income in retirement.
As for when people began saving for retirement:
Most (90%) of the mass affluent have retirement savings and began saving at 33 years old, but Millennials are planning for the future at a much younger age, with more than half (54%) starting between the ages of 18 to 24- Eighty percent of Millennials currently have retirement savings.
The most common trigger for those with retirement savings to begin investing for retirement was an account being offered at work (48%). Far fewer were spurred to invest due to major life events like getting married (18%) or having their first child (12%).
More millennials (36%) and Gen Xers (32%) than Boomers (15%) and Seniors (12%) were motivated to save for retirement when they started their first jobs. Almost three in ten (28%) Millennials first started saving for retirement after a raise or promotion at work, versus 10% of older generations.
The article can be read in the journal Pension Benefits. The report can also be viewed here.
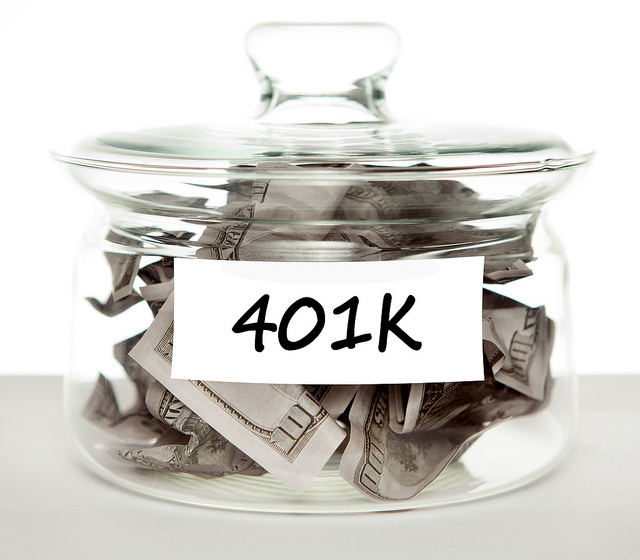
Photo by 401kcalculator.org