Analysis: AIMCo Gains 9.9% Net in 2014

496px-Canada_blank_map.svg

Leo Kolivakis is a blogger, trader and independent senior pension and investment analyst. This post was originally published at Pension Pulse.

The Alberta Investment Management Corporation (AIMCo) recently announced a total fund net return of 9.9% in 2014:

The net of fees return was 11.2% for pension and endowment Clients, and 4.4% for government and specialty fund Clients.

Annually, the board and management agree on active return targets consistent with top quartile return on active risk. Since 2009, AIMCo has earned its Clients value add of $2.5 billion net of fees. In 2014, AIMCo earned a net of fees return of 9.9%, underperforming its active return target of 10.5% by 0.6% or $401 million net of fees.

Public markets investments performed strong with public equities contributing $369 million and fixed income adding $167 million to value add. Private market investments also demonstrated strong returns in certain asset classes with real estate generating $145 million.

The primary driver of underperformance in 2014 may be attributed to losses incurred by AIMCo’s global tactical asset allocation strategy and the revaluation of certain prior year investments. In addition, certain illiquid asset classes lagged behind the very strong performance of their listed benchmarks, a not unexpected outcome given the diversification rationale for investment in these asset classes.

AIMCo’s investment performance by calendar year (net of fees) is broken down in the table below (click on image):

Also, here is a snapshot of the big picture of AIMCo’s asset mix, assets under management and net investment results as of December 31, 2014 (click on image):

AIMCo’s 2014 Annual Report is available on their site here. I strongly recommend you read it carefully to get a better understanding of the results across public and private markets. Also worth reading are the Chair and CEO messages.

I will bring your attention to this passage from Kevin Uebelein, AIMCo’s new CEO since January 2015, in his message (added emphasis is mine):

Our commitment is to be both client dedicated and performance driven in all aspects of our business, always seeking continuous incremental improvement. Ultimately it is to be truly world-class, not only in benchmarking our returns but in all facets of our business compared to the best asset managers wherever they may exist. We will do this in a spirit of collaboration internally with all employees, and with our clients and all stakeholders.

AIMCo remains committed to seek out the best investment opportunities for our clients with careful consideration of their unique liability and risk-return profiles. We will strive to be a transparent and trusted advisor and will work closely to understand client needs. We will match those needs to our capabilities and ensure that long-term stakeholder obligations are satisfied.

Similar to the Caisse, AIMCo has many clients but the points I highlighted have to do with benchmarking returns and liability-driven investments. Benchmarking in particular is one area where AIMCo excels relative to most of its larger Canadian peers. It’s not perfect, however, but still better than most other large pension funds and there is definitely no free lunch in private market benchmarks.

On benchmarks, AIMCo states the following (page 33):

AIMCo’s performance benchmarks measure what our Clients could earn by passively implementing their investment policy with bond and stock market index investments. The incremental return above what markets provide measures the contribution of active management, referred to as value add.

The selection of appropriate benchmarks is important in investment management. Done properly, it ensures alignment of the Client’s risk and return objectives to the investment strategy of the asset manager. Public market investment benchmarks comprise all of the attributes of an unbiased effective measure – transparent, stable, and investable. Illiquid asset classes are more difficult to benchmark given the lack of readily available comparison data for the physical assets invested in and due to the fact that by their very nature, these investments are expected to provide an illiquidity premium relative to the nearest listed proxy.

AIMCo and its Clients work together to identify the most appropriate benchmarks against which performance should be measured

Here are AIMCo’s benchmarks in all asset classes (click on image below from page 33):

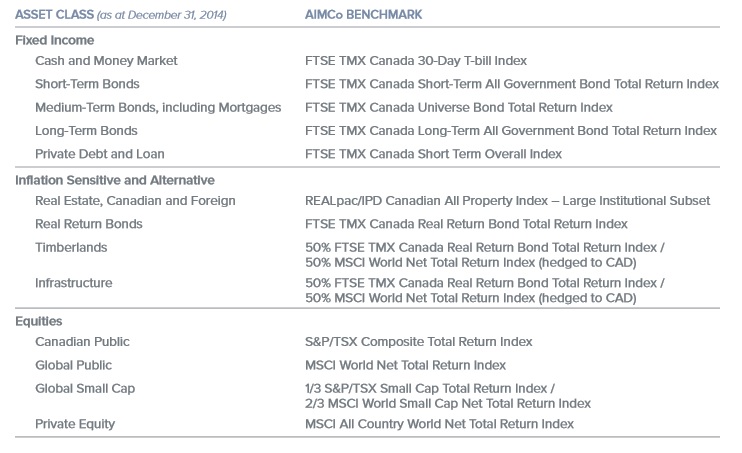
As you can see, public market benchmarks are pretty much self-explanatory but in private markets, there is no free lunch anywhere (unlike places like PSP Investments which needs to work on its private market benchmarks, especially in real estate and natural resources).

Are AIMCo’s private market benchmarks perfect? No, they’re not, but the truth is private market benchmarks aren’t perfect anywhere. In previous conversations I had with Leo de Bever (AIMCo’s former CEO) on this topic, he admitted it’s tough to benchmark private markets but he agreed with me that the benchmarks should reflect the opportunity cost of not investing in public markets plus a spread to compensate for leverage and illiquidity.

Of course, when it came down to it, Leo de Bever never recommended adding a spread to AIMCo’s Private Equity benchmark (MSCI All Country World Net Total Return Index) and stated to me that “in the long-run it all works out as there are some years where public markets surge and others where they grossly under-perform private markets.”

If you ask me, I actually think PSP finally got its Private Equity benchmark right (Private Equity Fund Universe and Private Equity cost of capital) but some will even argue that this doesn’t reflect the true opportunity cost of investing in an illiquid investment.

The point I’m trying to make is some large Canadian funds take benchmarking their private market portfolios much more seriously than others and this is important from a risk and compensation point of view.

Anyways, enough on benchmarking private markets, maybe I will delve deeper into this topic and tie it to compensation in a future comment on Canada’s pension plutocrats.

Here are the overall results for AIMCo for all its portfolios from page 34 of the Annual Report (click on image):

Keep in mind these are annualized net returns as of December 31st, 2014 for public and private market portfolios. I think this is one reason why AIMCo waits till June/ July to report its results as there is always a lag of a quarter for private market investments (valuation lag).

I emailed AIMCo’s CEO, Kevin Uebelein, to discuss there results. Kevin didn’t speak to me on AIMCo’s 2014 results (to be fair, he wasn’t the CEO at the time) but he was very responsive and directed me to Dénes Németh, Manager, Corporate Communication at AIMCo.

I actually sent an email to Dénes, Kevin and Leo de Bever asking these questions:

1) Why exactly did AIMCo underperform its benchmark in 2014? What repricing of which assets?
2) Performance of private equity is NOT clear. On one table (p. 34) with all the asset classes it is 11.9% vs benchmark of 13.5% but then on p. 38 it says private equity returned 21.7% outperforming its benchmark by 8.1%…very confusing!
3) AIMCo is now making opportunistic real estate investments outside of Canada (small percentage) but using a Canadian AAA real estate index?

Copied Leo de Bever here as he was the CEO in 2014. Also, with Alberta oil revenues falling fast, how will this impact AIMCo?

Dénes was kind enough to follow up with these answers:

1) Why exactly did AIMCo underperform its benchmark in 2014? What repricing of which assets?

As discussed elsewhere in the Annual Report, AIMCo’s illiquid investment classes such as Infrastructure, Timber and Private Equity use Public Market benchmarks. Combined, these asset classes account for approximately $7.5 billion or 9% of our AUM. The Public Market benchmarks experienced strong performance during the relevant period, resulting in a corresponding underperformance of the illiquid asset classes. We are continually reviewing our methods of measuring performance and in 2015 have undertaken a review of certain of our illiquid benchmarks in collaboration with our clients.

AIMCo holds illiquid investment in certain insurance-linked assets. These assets were revalued in 2014 for a number of reasons, including updated information, better clarity on the application of accounting principles and the increasing sophistication of the relevant market.

2) Performance of private equity is NOT clear. On one table (p. 34) with all the asset classes it is 11.9% vs benchmark of 13.5% but then on p. 38 it says private equity returned 21.7% outperforming its benchmark by 8.1%…very confusing!

The $3.3 billion Private Equity asset class noted on Page 34 is an aggregated total comprising three main strategies – Private Equity Investments, as well as, AIMCo’s Relationship Investing and Venture Capital. The aggregate return of 11.9% does not provide a true picture of how each strategy performed, so to provide the reader additional detail, we chose to break out the MD&A by specific strategy on Page 39. I appreciate how it can be confusing, so in future reports we will consider adding a line to clarify.

3) AIMCo is now making opportunistic real estate investments outside of Canada (small percentage) but using a Canadian AAA real estate index?

We invest opportunistically in real estate in foreign markets as an alternative to investing in Canada. We use the REALpac / IPD Canadian All Property Index – Large Institutional Subset to judge the performance of those foreign assets against what we would have earned had we instead invested within Canada.

A few comments on those answers. Basically, Relationship Investing and especially Venture Capital really underperformed, hurting the overall (aggregate) net returns in Private Equity. I was never a big fan of Canadian venture capital (or VC in general) and have seen huge losses in this space while working as a senior economist at the Business Development Bank of Canada. I even told Leo de Bever about this and he agreed with me that VC is a tough gig but “AIMCo was investing in late stage VC”.

As for Real Estate, I appreciate Dénes’s response but I caution stakeholders everywhere, Canadian residential and commercial real estate is in for a long, tough slug now that Canada’s crisis is well underway and comparing opportunistic foreign real estate investments to the REALpac / IPD Canadian All Property Index – Large Institutional Subset just doesn’t make sense.

Now to be fair, AIMCo’s foreign real estate holdings make up roughly 20% of the Real Estate portfolio, and most of this isn’t opportunistic real estate (it is core) but this is still something to keep in mind when gauging whether the real estate benchmark appropriately reflects the underlying risks of the Real Estate portfolio (another example of how private market benchmarks have to be reevaluated ever so often to determine whether they reflect real risks of underlying portfolio).

I will leave it up to my readers to carefully read AIMCo’s 2014 Annual Report to get more information on their public and private investments as well as other information.

In terms of compensation, the table below from page 69 provides a summary for the compensation of AIMCo’s senior officers (click on image):

As you can see, Leo de Bever, AIMCo’s former CEO tops the compensation at $3,728, 374. Over the last three calendar years (2012, 2013, 2014), he made just shy of $10 million, which is considerably more than I thought he earned when I wrote the list of highest paid pension fund CEOs. Dale MacMaster, who is now AIMCo’s CIO, enjoyed the second highest total compensation in 2014 of $2,049, 952.

Again, keep in mind compensation is based on rolling four-year returns over benchmarks. The fact that AIMCo underpeformed its benchmark in 2014 will have an impact on future compensation. Also, as I stated above, there’s no free lunch for AIMCo’s private markets managers, which makes beating their overall benchmark that much more difficult.

Let me end by showing you a picture I liked in AIMCo’s Annual Report (click on image):

When I speak of the importance of diversity in the workplace, this is what I’m talking about. Not to offend anyone but I’m tired of seeing old white males leading public pension funds and hiring young white males who think and act like them. I think the image above represents the real cultural diversity of Canada and I applaud AIMCo for showing many pictures like this in the Annual Report, highlighting its commitment to real diversity.

One area where I will criticize AIMCo is that they need to do a better job communicating their results to the media. Dénes Németh, Manager, Corporate Communication at AIMCo, is a good guy and he did respond promptly to my request upon returning from his vacation, but where is the press release on results and where are the articles in Canada’s major newspapers? (makes me wonder if this was deliberate because AIMCo undeprfermored its benchmark in 2014).

Still, I enjoyed reading AIMCo’s 2014 Annual Report and wish Kevin Uebelein and the rest of AIMCo’s senior officers and employees much success in navigating these tough markets over the next few years.

Lastly, I agree with Leo de Bever, these are dark days for Alberta’s energy industry. If anything, the outlook seems to grow more depressing by the week. I think Alberta is pretty much screwed for the next five to ten years and I blame the Harper Conservatives for putting all their focus on oil sands projects, neglecting Canada’s manufacturing industry in Ontario and Quebec (I know, worked at Industry Canada for a brief stint and saw massive budget cuts at the worst possible time). Canada’s leaders have learned nothing from past mistakes. That’s why I’m still short Canada even if the U.S. recovery continues for now.

[To be fair, the sorry state of manufacturing in Canada isn’t just about massive cutbacks from the federal government. Gary Lamphier of the Edmonton Journal makes a valid point when he shared this with me in an email: “I frankly put more blame on Canadian companies that were unwilling to innovate and spend money on new equipment when the loonie was at $1.10 US. Now they’re back to the same old game they played in the 1990s, hoping the low dollar will bail them out. So it’s the manufacturing sector itself that is largely to blame, not Harper’s government !! Now THAT is something you will NEVER hear in the Toronto-centric ‘national’ media — and I say that as a guy who spent 35 years of his life in Ontario, a big chunk of it reporting on the auto sector.”]


Photo credit: “Canada blank map” by Lokal_Profil image cut to remove USA by Paul Robinson – Vector map BlankMap-USA-states-Canada-provinces.svg.Modified by Lokal_Profil. Licensed under CC BY-SA 2.5 via Wikimedia Commons – http://commons.wikimedia.org/wiki/File:Canada_blank_map.svg#mediaviewer/File:Canada_blank_map.svg

Video: Retirement Income Trends and Pension Reforms Panel Discussion

Here’s a very interesting panel discussion that was held at last month’s Retirement Security Summit, organized by the Center for State and Local Government Excellence (SLGE).

[The panel begins at around the 49:30 mark of the video; if you start from the beginning, you can hear a keynote speech from Dallas Salisbury, President and CEO of the Employee Benefit Research Institute.]

The discussion is centered around retirement income trends and pension reforms; panelists included:

-Dana Bilyeu, Executive Director, NASRA
-Bob Schultze, President and CEO, ICMA-RC
-Gerri Madrid Davis, Director, Financial Security & Consumer Affairs, State Advocacy & Strategy Integration, AARP
-Wendy Dominguez, President and co-founder, Innovest Portfolio Solutions LLC


Video credit: Center for State and Local Government Excellence

Photo by TaxRebate.org.uk via Flickr CC License


Illinois Senate Approves Measure to Lower Chicago Schools’ Pension Contributions, Extend Funding Deadline

640px-Gfp-illinois-springfield-capitol-and-sky

The Illinois Senate on Wednesday passed a bill that decreases the annual pension contribution required from Chicago Public Schools over the next two years.

The bill also gives CPS four more years to reach its 90 percent funding target.

From Pensions & Investments:

The measure passed the Senate on Tuesday by a 37-1 vote and headed to the House.

SB 318 requires the state to contribute $200 million to the teachers’ pension fund for the current fiscal year ending June 30, 2016, and extends the deadline for the teachers’ pension plan to reach 90% funding to 2063 from 2059. Currently, the pension plan is about 51.5% funded.

Further, SB 318 reduces Chicago Public Schools’ required pension contribution for fiscal year 2016 to $207 million and provides a tax levy to help cover pension costs.

A statement on the pension fund’s website says it opposes the changes. “An increase in state contributions and the reinstatement of our tax levy are important steps toward full funding,” said Charles A. Burbridge, the pension fund’s executive director, in a letter on pension fund’s website.

The contribution cut is massive; the 2016 payment’s original amount was in the ballpark of $700 million, but will be reduce to around $200 million if the bill moves forward.


Photo credit: “Gfp-illinois-springfield-capitol-and-sky” by Yinan Chen – www.goodfreephotos.com (gallery, image). Via Wikimedia Commons – http://commons.wikimedia.org/wiki/File:Gfp-illinois-springfield-capitol-and-sky.jpg#mediaviewer/File:Gfp-illinois-springfield-capitol-and-sky.jpg

Video: CalPERS’ Anne Simpson Talks Proxy Access Efforts

https://youtu.be/NnhpG0nEC84

CalPERS posted its latest episode of “Insight” this week, and the topic is an interesting one: the push from pension funds (acting as shareholders) to have a bigger say in the corporate governance of companies — specifically the board nomination process.

Here’s the video description:

Anne Simpson, CalPERS Director of Global Governance, explains the significance of recent progress toward a greater say by shareowners in the selection of corporate boards.
In this Insight interview with host Bob Burton, Simpson defines the focus of current CalPERS efforts to enhance corporate performance through improved attention to environmental, social, and governance concerns.

CalPERS Weighs In On Controversial Upcoming Pension Ballot Measure

Calpers

CalPERS CEO Anne Stausboll recently penned a letter weighing in on the state’s upcoming pension ballot measure – and suggested the measure could pose problems for the pension fund and might even be illegal.

[Read more about the measure here.]

Stausboll wrote the letter to a state lawmaker, but it was obtained this week by Reuters. From Reuters:

Anne Stausboll, the chief executive officer of the California Public Employees’ Retirement System, said in a letter the ballot measure could also create problems with the IRS and could create huge additional costs for Calpers, which has assets of more than $300 billion.

[…]

Although [former San Jose mayor Chuck] Reed’s ballot initiative seeks to cut pensions for new hires, Stausboll said the initiative might also end up cutting benefits for existing workers. She said that could be illegal because it would breach the so-called “California rule”, which states that workers cannot see benefits cut after they are hired.

Stausboll said the initiative “could create issues with the Internal Revenue Service” and threaten Calpers’s tax exempt status. She also said the initiative, if it succeeds, would effectively end death and disability benefits and the closing of defined benefit plans to new workers would upend Calpers’s accounting assumptions, “requiring new investment strategies and actuarial assumptions.”

Reed said of Stausboll’s comments: “Calpers is largely responsible for the trouble we are in now and they are quite happy with the status quo. They are not exactly an impartial party. I’m not surprised they would find fault with our initiative.”

CalPERS is the country’s largest public pension fund.


Photo by  rocor via Flickr CC License

Double Jeopardy for Pension Plan Sponsors Selling Businesses: Have You Provided Spinoff Notices?

2434691031_dc47fc162a_z

Carol Buckmann is an attorney who has practiced in the employee benefits field for over 30 years. This post was originally published at Pensions & Benefits Law.

There are many benefits issues that must be dealt with when businesses are sold, including the potential involvement of the Pension Benefit Guaranty Corporation (“PBGC”)    See, e.g,  my prior blog post.  Not all of these issues are resolved at the time of sale.

It is becoming increasingly common for plan sponsors who have sold businesses to hear from former participants who were spun off to a buyer’s plan, but who claim to still have benefits owing under the seller’s plan. Sometimes this is because the buyer has gone into bankruptcy or attempted to pass its plan on to the PBGC, but one very frustrating aspect of these former employee requests is that they arrive almost always many years after the sale. Sellers typically respond that no benefits are owed because the buyer assumed full responsibility for their pensions. But is this sufficient?  Maybe not, as a federal district court in Utah has ruled that former participants are entitled to benefits under both their original plan and their new plan for the same period of service because they were not notified of the transfer of their benefits.  Here is the decision. This is clearly a result that the parties never intended.  This award could also create unanticipated funding problems for the seller’s plan, since these benefits were assumed by a new plan and thus were not being pre-funded. How can plan sponsors avoid it?

Defendants’ Mistakes. Plaintiffs requested pension benefits from a successor to their original plan sponsor, even though they were currently receiving or entitled to receive benefits from their new plan for the same service. The original plan sponsor responded that the successor company indicated that it had assumed liabilities for the claimed benefits, but did not cite any plan provision. The original plan failed to produce evidence for the court that participants had received notice of their transfer from one plan to the other.

The Violation. The court cited ERISA’s rules for providing summaries of material plan modifications within 210 days following the end of the plan year in which the change occurred. Since defendants couldn’t show they had provided the notice, the court found that the spinoff amendment was ineffective and defendants abused their discretion in denying benefits.

Did the Court Go Too Far? The Utah decision seems an overreaction to this compliance failure, as ERISA already contains a specific dollar penalty for failure to provide the required notice.   The decision does not discuss another requirement that could have applied if the transfer were done today.  There is a current requirement that participants be given advance notice of amendments that result in a reduction of future accruals. (This requirement might apply in spinoffs, depending on the plan text.)   ERISA specifically authorizes ignoring a plan amendment that would reduce benefits if this new notice was not given and there was an “egregious violation”.   If Congress had intended a similar remedy for failure to provide notice of material plan changes, it presumably would have provided for it.

What Could Defendants Have Done? We don’t know whether other courts will follow this decision, but the following practices put sponsors in a position to respond effectively to double-dipping claimants:

  1. Keep accurate records of former participants whose benefits have been transferred. Do not transfer all copies to the buyer.
  2. Put language in both the plan and the SPD stating that participants will cease to accrue benefits when they terminate employment and, in the case of a spinoff, will have no right to past service benefits under the plan.
  3. Send all affected participants a written notice of the spinoff, specifically stating that they will cease to accrue benefits under the original plan , and identifying the new plan under which they will be covered.
  4. Keep copies of the notices that were sent and evidence of the manner of distribution as part of permanent plan records.
  5. Include offset provisions in the plan document to prevent double accruals for the same period of service.

Photo by Juli via Flickr CC License

CalPERS Readies Fee Disclosure; Carried Interest Expected to “Be In the Billions”

Calpers

Last month, CalPERS began asking its general partners for data on profit-sharing fees – called carried interest – dating back to 1998.

Pension funds keep tabs on management fees, but don’t typically disclose (or even track) carried interest, so observers are waiting intently for this disclosure.

CalPERS is now readying the release of the carried interest figure, and this week fund CIO Wylie A. Tollette said the number is expected to “be in the billions”.

From the LA Times:

Wylie A. Tollette, CalPERS’ chief operating investment officer, said CalPERS plans to disclose the grand total of carried interest it has paid out from funds operating since 1998, and “it’s going to be in the billions.”

“It’s a dilemma,” he added. “You don’t want it to be astronomically high because that represents profits that you wanted to grab for yourself.” But he said CalPERS needs the high returns private equity traditionally has provided, and the fee figure represents the going rate.

“It’s about time,” [CalPERS board member J.J.] Jelincic said in an interview. “I knew we weren’t disclosing it. I was shocked to find out we weren’t even tracking it. It’s obviously good to know what the hell we’re paying.”

[…]

Private equity defenders say the carried interest issue has been wildly misunderstood and that what critics call a “fee” is actually just a share of profits taken out by private equity firms before delivering investors’ share, known as the “net return.” As such, it doesn’t need to be reported as a pension fund expense. What’s more, they say, carried interest costs have always been available to investors in audited financial statements, even if not always in a uniform format.

CalPERS manages $300 billion in assets.


Photo by  rocor via Flickr CC License

Kansas Pension Bonds Rated By Moody’s

480px-Seal_of_Kansas.svg

Kansas will likely issue $1 billion in pension bonds in the coming months, and Moody’s this weekend assigned those bonds an Aa3 rating, with a stable outlook.

In a bid to improve funding levels of the state’s major pension system, the proceeds from the bonds will go straight into the portfolio of the Kansas Public Employees’ Retirement System.

Pension360 recently covered how at least some officials were wary of the bond plan.

More on the Moody’s rating from KSHB:

Moody’s Investors Service this week assigned a rating of Aa3 to the bonds, which the state hopes to sell next month. That’s one notch below the Aa2 rating for Kansas and a standard decrease when a state’s legislature must appropriate money for annual bond payments.

The ratings agency also said its outlook for the bonds is stable.

The state pension system expects to earn significantly more from investing the funds raised by the bonds than the state will pay to retire the debt over 30 years.

The state is limited to paying 5 percent interest to bond investors.

Issuing pension bonds is a calculated gamble: if the resulting investments return more than the bond’s interest rate (in this case, 5 percent), then the state comes out on top.

If markets don’t cooperate, the state could be on hook for the difference.

Teacher Experience Varies: An Example from Maryland

6284181389_36af02b058_z

Years of service is one of the most important variables in determining pension benefits. But as the following analysis by Kirsten Schmitz shows, experience levels vary dramatically between schools, even in the same state — and that has implications for schools trying to grapple with pension costs.

This article was originally published on TeacherPensions.org

By Kirsten Schmitz

Teacher experience levels can vary dramatically state-to-state, but experience levels vary even more within states.

To show what this looks like, I’ve analyzed a dataset from the state of Maryland showing how experience levels vary by district. Data collected in the fall of 2011 found that, on average, 31% of all Maryland public school teachers had zero to five years of teaching experience. Another 24% had six to ten years of experience, 28% had 11 to 20 years, and only 18% had been in the classroom more than 20 years.

Some district workforces look very different from the state average, however. In Prince George’s County, for example, 42% of teachers had been working less than six years, with numbers in Charles County and Baltimore City County hovering near 40%. At the SEED school, a tuition-free public boarding school founded in 2008, nearly half its instructional staff was relatively new to the profession.

Other counties had much more experienced workforces. In Calvert County, for example, just 10% of teachers had five or fewer years of experience, and more than 60 percent of its teachers had 20 or more years of experience. Calvert County, a growing exurb south of Washington, D.C., has a median household income of $87,449, placing it amongst the top 20 wealthiest U.S. counties. Calvert joins Garrett, Allegany, Carroll, Worcester, Frederick, St. Mary’s, Montgomery and Harford, all districts where 50% or more of their teacher workforce has at least 11 years of experience.

These numbers reflect the range of challenges different districts face. Counties like Prince George’s, Charles, and Baltimore City employ much more mobile workforces, and thus spend more time and resources recruiting and training new teachers than Allegany, Garrett, and Calvert counties. Similarly, pension plans play out very differently amongst these two types of districts. Those with a more stable workforce are likely to reap larger benefits from the pension system, while districts with greater teacher turnover are likely to subsidize the pensions of everyone else.

A district’s teacher experience breakdown can reveal information about wide-reaching disparities, whether they be teacher turnover, resource allotment, or pension savings. Years of experience continues to persist as a key variable in teacher pension formulas, as well as salary negotiations. A revolving door of short- term teachers in some districts can end up padding the retirement benefits of others.

Photo by cybrarian77 via Flickr CC License

Pension Pulse: Risk On, Risk Off?

4555108439_c3aba7565b_z

Leo Kolivakis is a blogger, trader and independent senior pension and investment analyst. This post was originally published at Pension Pulse.

Svea Herbst-Bayliss and Lawrence Delevingne of Reuters report, Hedge fund Elliott eyes fresh market turbulence:

Paul Singer’s $27 billion hedge fund Elliott Associates is worried about Europe’s prospects and is bracing for fresh market turbulence.

In a letter to investors dated July 23 and seen by Reuters on Thursday, the New York-based firm told clients that it has returned 2.8 percent in its Elliott Associates, L.P. and 2.2 percent in its Elliott International Limited.

While both funds beat the Standard & Poor’s 500 Stock Index’s 1.2 percent gain, the fund spent pages explaining its more cautious approach and warning that even after a six-year bull market in stocks, there is “no such thing as a permanent trend in the markets.”

It worries about central bankers’ easy money policy noting that governments that have “abused the power to create ‘money’ have always, eventually, paid a huge price for their profligacy.”

“We are not bragging about our record, nor do we feel defensive about not keeping up with the S&P 500 in the last few years,” adding that it invests carefully especially at a time it sees more chance for severe market turmoil.

It also expressed concern about Europe even after the region found a solution to Greece’s debt problem and worries that long-term problems have not been adequately addressed, possibly causing “the breakup of the euro.”

“The bottom line in our view is that Europe is in a very difficult situation,” the fund wrote.

Still Elliott sees what it calls “attractive opportunities in the activist equity area and a few interesting situations in event arbitrage.” The firm recently lost a campaign to block the merger of two Samsung affiliates in Korea.

It also said it is cooling on real estate investments, noting “the balance in our real estate securities trading has turned to the sell side.”

The firm recently raised $2.5 billion in new capital, calling it “dry powder.”

But it also warned investors in the normally secretive hedge fund world to stop sending its closely followed letters to journalists and others.

“We have learned the identities of certain individuals who breached their confidentiality obligations by disclosing the contents of Elliott’s quarterly reports,” the firm wrote adding “We are taking action and seeking monetary damages from violators.”

The Wall Street Journal first reported on Elliott’s tough stance to keep its letters private.

I would ask Paul Singer and all other “elite hedge fund gurus” to make their quarterly or monthly letters to investors public as most of the money they manage comes from public pension funds.

Singer is an outspoken critic of central banks engaging in quantitative easing and has recently stated that bonds are the bigger short. I disagree with him on that call as I see the return of deflation — or more precisely, the continuation of deflation — wreaking havoc on the global economy for a prolonged period, which basically means we haven’t seen the secular low in Treasury bond yields.

But I agree with Singer that the latest deal to save Greece and Europe is effectively a sham and that European leaders have failed to address deep structural issues that threaten the eurozone’s future. In fact, despite massive QE from the ECB, I’m convinced the euro deflation crisis will rage on, wreaking havoc on unsustainable debts of periphery economies but also on core eurozone economies.

I also agree with Singer’s call to shed real estate assets and raise cash to have “dry powder” at hand for opportunities. And in these volatile markets, there will be plenty of opportunities at hand but you need to pick your spots carefully or risk getting slaughtered.

Singer’s Elliott Associates is doing relatively well, beating the S&P 500. Most hedge funds are struggling to remain open. The rout in commodities has annihilated many commodity hedge funds. The Wall Street Journal reports that Cargill’s Black River Asset Management plans to shut down four of its hedge funds and return more than $1 billion to investors over the next several months.

Fortress Investment Group (FIG) on Thursday said its liquid hedge funds posted a $6million pre-tax loss for the second quarter as a result of turmoil at its flagship hedge fund portfolio that bets on global economic trends, sending its shares down.

Earlier this week, Laurence Fletcher of the Wall Street Journal reported, Hedge Fund’s Assets Fall by 95%:

One of the big hedge fund winners of the credit crisis has become a major loser in the era of easy money.

London-based bond-trader Mako Investment Managers LLP was a star performer in 2008 and investors poured money into its flagship Pelagus Capital Fund. But assets under management have fallen 95% since the end of 2012 due to weak returns and because investors have yanked their money.

Pelagus’s assets stood at $1.14 billion at the end of 2012, according to a person familiar with the matter, and have fallen to just $59 million at the end of June, according to an investor letter reviewed by The Wall Street Journal.

The decline highlights the difficulties faced by bond funds that have struggled to generate performance as huge quantitative easing programs by major central banks have suppressed volatility in the market.

On average, hedge funds that trade sovereign bonds are up 2.1% in the first half of this year, according to Hedge Fund Research, having gained just 1.2% in both 2013 and 2014—those results significantly lag the average return from hedge funds as a whole.

“QE has almost killed these strategies,” said one major European investor in hedge funds.

Among funds to have struggled trading interest rates in recent years is Brevan Howard’s $21.7 billion flagship macro fund, which last year posted its first-ever down year, according to a letter to investors. The BlueCrest Capital International fund, another major macro fund, made just 0.1% last year, according to regulatory filings. Macro funds bet on stocks, currencies, bonds and other assets.

Mako’s chief investment officer, Bruno Usai, said “near-zero interest rates and low market volatility” mean it is tough for funds such as Pelagus to make the double-digit returns of previous years.

In 2008, Pelagus made a return of 33.1%, according to an investor letter reviewed by The Wall Street Journal, while hedge funds on average lost 19% that year, according to data group Hedge Fund Research.

But recent performance has seen the fund lose money in each of the past 12 months, according to the letter. The fund is down 3.4% so far this year to the end of June and lost 4.1% last year, having made only small gains in each of the previous three calendar years.

According to the letter, the fund underestimated how Greece’s debt crisis would hit European bond markets—European sovereign bond yields rose as the crisis escalated—meaning the fund put on some trades too early. It didn’t specify the trades it put on.

Mr. Usai said the firm plans to launch a new fund before the end of September. He said it was an “irony” that investors are leaving funds such as his “just as fixed income volatility is starting to pick up and the Fed is on course to raise official rates this year.”

I keep warning my institutional readers to ignore your useless investment consultants and stop chasing after the hottest hedge funds. Most of the time, you’ll get burned.

And while quantitative easing has made it tougher to make money trading sovereign bonds, I’m sick and tired of these excuses. Either your fund can adapt and deliver alpha, or simply bow out and return the money back to your investors.

We all know about quantitative easing and the pending liquidity time bomb, but institutions are paying big fees to hedge funds to navigate through this difficult environment. If they can’t deliver alpha, they should get out and return the money to their investors way before losing 95% of their assets (investors should have pulled the plug on Mako years ago!).

All this talk on hedge funds struggling to deliver alpha led me to go back to reading the wonderful letters from Absolute Return Partners. Niels Jensen and his team offer investors some great food for thought. In June, Niels asked whether bond investors are crying wolf, concluding this is NOT the beginning of something much bigger and that economic growth will stay low for many years to come, and central banks have no intentions of suddenly flooding the bond market with sell orders.

In his July comment, A Return to Fundamentals?, Jensen notes that financial markets have in many ways behaved oddly since the near meltdown in 2008 and looks at whether we are finally beginning to see some sort of normalisation – as in a return to the conditions we had prior to 2008 – and what that would mean in practice.

He concludes:

“Overall, I don’t see any clear signs that the risk on, risk off mentality, which has ruled since 2008, is finally coming to an end. Yes, correlations have begun to recede a little bit here and there; however, if it is indeed a sign of bigger things to come, it is still very early days.”

I highly recommend you make a habit of reading the letters from Absolute Return Partners. There is obviously some self-promotion but they will provide you with a lot of great insights on markets and alternative investments.

What do I think? I think Risk On/ Risk Off markets are here to stay. This is all a product of the liquidity tsunami from central banks around the world to counter the threat of global deflation, and illiquidity in fixed income markets.

In terms of equities, I’ve already told you we could be setting up for some nice countertrend rallies in Chinese (FXI), emerging markets (EEM), energy (XLE), commodities (GSG), metals and mining (XME), and gold (GLD) shares in the next few months, especially if global growth improves, but I would steer clear of these sectors. There will be violent short covering rallies but the trend is inexorably down.

My long-term forecast of global deflation remains intact which is why even though I might be tempted to trade countertrend rallies in energy and commodities, I keep steering clear of these sectors in favor of tech (QQQ) and biotech (IBB and XBI). Here too, it’s very volatile, but I continue to buy the dips in biotechs I track as I think the long secular bull market in this sector is still in the early innings.

By the way, here is a small list of small biotechs I track and trade (click on image):

Some have performed better than others but they’re all volatile and if you have no experience trading biotechs, stick to the indexes (IBB and XBI) or avoid this sector altogether. You literally have to stomach insane volatility and be very patient at times in order to make big profits.

Hope you enjoyed reading my weekend comment. As always, please remember to click on my ads and more importantly to donate or subscribe to this blog via PayPal at the top right-hand side (go to PensionPulse.blogspot.com). I sincerely thank all of you who have supported my efforts to bring you the latest insights on pensions and investments.


Photo by Roland O’Daniel via Flickr CC License


Deprecated: Function get_magic_quotes_gpc() is deprecated in /home/mhuddelson/public_html/pension360.org/wp-includes/formatting.php on line 3712