
The median U.S. public pension fund returned 6.8 percent in 2014.
But north of the border, one of Canada’s largest public funds blew that figure away.
Caisse de depot et Placement du Quebec, Canada’s second-largest pension fund, posted investment returns of 12 percent in 2014, nearly doubling the returns of its U.S. peers.
Over at Pension Pulse, Leo Kolivakis dives deep into Caisse’s 2014 results. What did he find? The post is re-printed below.
_______________________
By Leo Kolivakis, Pension Pulse
You can gain more insights on the Caisse’s 2014 results by going directly on their website here. In particular, the Caisse provides fact sheets on the following broad asset classes:
Keep in mind that unlike other major Canadian pension funds, the Caisse has a dual mandate to promote economic activity in Quebec as well as maximizing returns for its depositors.
In fact, the recent deal to handle Quebec’s infrastructure needs is part of this dual mandate. Some have criticized the deal, questioning whether the Caisse can make money on public transit, but this very well might be a model they can export elsewhere, especially in the United States where CBS 60 Minutes reports infrastructure is falling apart.
Whether or not the Caisse will be successful in exporting this infrastructure model to the United States remains to be seen but if you follow the wise advice of Nobel laureate Michael Spence on why the world needs better public investments, public pensions investing in infrastructure could very well be the answer to a growing and disturbing jobs crisis plaguing the developed world.
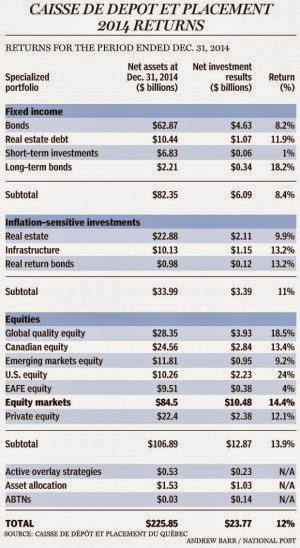
As far as the overall results, they were definitely solid, with all portfolios contributing to the overall net investment of $23.77 billion (click on image below):
Of course, what really matters is value-added over benchmarks. After all, this is why we pay Canadian pension fund managers big bucks (some a lot more than others).
In fact, in its press release, the Caisse states in no uncertain terms:
“[its] investment strategy centers on an absolute return approach in which investment portfolios are built on strong convictions, irrespective of benchmark indices. These indices are only used ex post, to measure the portfolios’ performance. The approach is based on active management and rigorous, fundamental analysis of potential investments.”
I’ve already discussed life after benchmarks at the Caisse. So how did their active management stack up? For the overall portfolio, the 12% return edged out the fund’s benchmark which delivered an 11.4% gain, adding 60 basis points of value-added last year (do not know the four year figure).
Below, I provide you with the highlights of the three main broad asset classes with a breakdown of individual portfolios (click on each image to read the highlights):
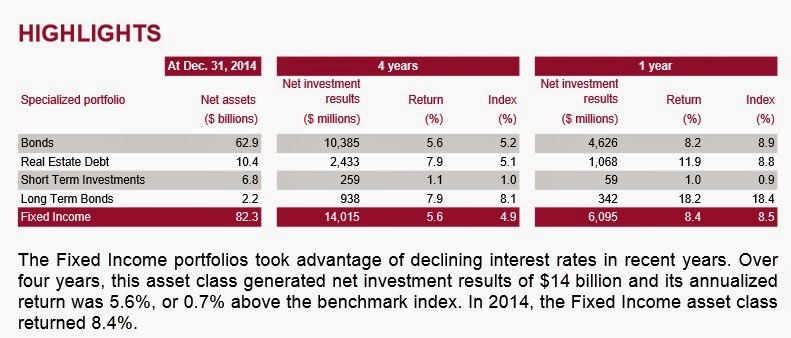
Fixed Income:
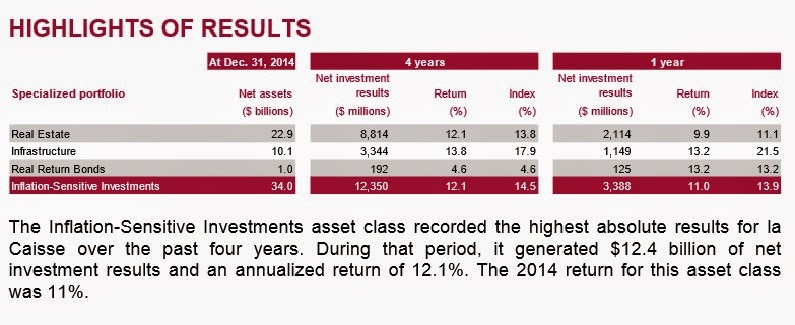
Inflation-Sensitive:
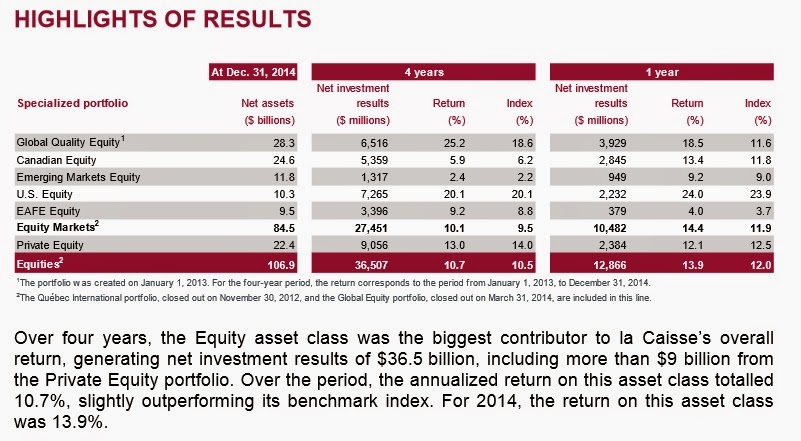
Equities:
Some quick points to consider just looking at these highlights:
- Declining rates helped the Fixed Income group generate strong returns in 2014 but clearly the value-added is waning. In 2014, Fixed Income returned 8.4%, 10 basis points under its benchmark which gained 8.5%. Over the past four years, the results are better, with Fixed Income gaining 5.6%, 70 basis points over its benchmark which gained 4.9%. Real estate debt was the best performing portfolio in Fixed Income over the last year and four years but on a dollar basis, its not significant enough to add to the overall gains in Fixed Income.
- There were solid gains in Inflation-Sensitive assets but notice that both Real Estate and Infrastructure underperformed their respective benchmarks in 2014 and the last four years, which means there was no value-added from these asset classes. The returns of Infrastructure are particularly bad relative to its benchmark but in my opinion, this reflects a problem with the benchmark of Infrastructure as there is way too much beta and perhaps too high of an additional spread to reflect the illiquid nature and leverage used in these assets. More details on the Caisse’s benchmarks are available on page 20 of the 2013 Annual Report (the 2014 Annual Report will be available in April).
- In Equities, Private Equity also slightly underperformed its benchmark over the last year and last four years, but again this reflects strong gains in public equities and perhaps the spread to adjust for leverage and illiquidity. U.S Equity led the gains in Equities in 2014 but the Caisse indexes this portfolio (following the 2008 crisis) so there was no value-added there, it’s strictly beta. However, there were strong gains in the Global Quality Equity as well as Canadian Equity portfolios relative to their benchmarks in 2014 and over the last four years, contributing to the overall value-added.
If you read this, you might be confused. The Caisse’s strategy is to shift more of its assets into real estate, private equity and infrastructure and yet there is no value-added there, which is troubling if you just read the headline figures without digging deeper into what makes up the benchmarks of these private market asset classes.
The irony, of course, is that the Caisse is increasingly shifting assets in private markets but most of the value-added over its benchmarks is coming from public markets, especially public equities.
But this is to be expected when stock markets are surging higher. And as a friend of mine reminded me: “It about time they produced value-added in Public Equities. For years, they were underperforming and so they came up with this Global Quality Equity portfolio to create value.”
Also, keep in mind private markets are generating solid returns and as I recently noted in my comment on why Canadian pensions are snapping up real estate:
… in my opinion the Caisse’s real estate division, Ivanhoé Cambridge, is by far the best real estate investment management outfit in Canada. There are excellent teams elsewhere too, like PSP Investments, but Ivanhoe has done a tremendous job investing directly in real estate and they have been very selective, even in the United States where they really scrutinize their deals carefully and aren’t shy of walking away if the deal is too pricey.
There is something else, the Caisse’s strategy might pay off when we hit a real bear market and pubic equities tank. Maybe that’s why they’re not too concerned about all the beta and high spread to adjust for leverage and illiquidity in these private market benchmarks.
But there are skeptics out there. One of them is Dominic Clermont, formerly of Clermont Alpha, who sent me a study he did 2 years ago showing the Caisse’s alpha was negative between 1998 and 2012. Dominic hasn’t updated that study (he told me he will) but he shared this:
I had done a study two years ago that showed that the Caisse’s alpha was close to -1% and close to statistically significantly different from zero and negative. Part of that regular value lost is compensated by taking a lot more risk than its benchmark by being levered. That leverage means doing better than the benchmark when the markets do perform well, and being in a crisis when the market tanks…
I asked him to clarify this statement and noted something a pension fund manager shared with me in my post on the highest paid pension fund CEOs:
Also, it’s not easy comparing payouts among Canada’s large DB plans. Why? One senior portfolio manager shared this with me:
“First and foremost, various funds use more leverage than others. This is the most differentiating factor in explaining performance across DB plans. In Canada, F/X policy will also impact performance of past 3 years. It’s very hard to compare returns because of vastly different invest policies; case in point is PSP’s huge equity weighting (need to include all real estate, private equity and infrastructure) that has a huge beta.”
Dominic came back to me with some additional thoughts:
I would love to do proper performance attribution, but I had limited access to data. But we can infer a lot with published data. We do have historical performance for all major funds like the Caisse, CPP, Teachers, PSP, etc. in their financial statements. They also publish the performance of their benchmark.
I agree that because of different investment policies, it is difficult to compare one plan to the next. But we can compare any plan to itself, i.e. its benchmark.
Again, I like to do proper performance attribution in a multivariate framework and that is one area of expertise to me. To do it on a huge plan like the Caisse would require a lot of data which I do not have access to. But a simple CAPM type of attribution would give some insight. In this case, the benchmark is not an equity market as in the base case of CAPM, but the strategy mix of the Caisse.
Thus if we regress the returns (or the excess returns over risk free rate) of a plan, over its benchmark return (or excess over RF rate), we would obtain a Beta of the regression to be close to one if the plan is properly managed with proper risk controls. That is what I obtain when I do this exercise with the returns of a well-known plan – well known for its quality of management, and its constant outperformance.
When I do this for the Caisse, I get a Beta of the regression significantly greater than 1 – close to 1.25. It looks like the leverage of the Caisse over the 15 years of the regression was on average close to 25% above its benchmark! Now part of that as you mentioned and as I explain in my study could come from:
- Investment in high Beta stocks,
- Investment in levered Private equity
- Investment in levered Real Estate and Infrastructure
- Investment in longer duration bonds
- Leveraging the balance sheet of the plan: Check Graphic 1 on the link: http://www.clermontalpha.com/cdpq_15ans.htm
It shows the leverage of the Caisse going from 18% in 1998 to 36% in 2008! So my average of 25% excess Beta is in line with this documented leverage.
The chart also shows Ontario Teachers’ and OMERS’ leverage. The difference is that Teachers’ leverage is IN its benchmark, while the Caisse is NOT. Thus the Caisse is taking 25% more risk than its clients’ policy mix! You would think that all these clients risk monitoring would be complaining… They are not.
Of course, that leverage is good when markets return positively and you can see that on the colored chart. But that leverage is terrible when the markets drop 2008, 2002, 2001. When that happen, it is time to fire the management, restart with a new one and blame the previous management for the big loss. Some of those big losses were also exaggerated by forced liquidation accounting (we all remember the ABCP $6 billion loss reserve which was almost fully recovered in the following years inflating the returns under the new administration).
By not doing proper attribution, we are not aware of the continuous loss (negative alpha) hidden by the excess returns not obtained by skilled alpha, but by higher risk through leverage. The risk-adjusted remains negative… And we are not focusing our energies into building an alpha generating organisation with optimal risk budgeting. Why bother, the leverage will give us the extra returns! But that is not true alpha, not true value added.
Which brings me to the alpha of the regression. I told you that this other great institution which does proper risk controls, gets a Beta close to one. They also get a positive alpha of the regression which is statistically significant (t stat close to 2). Not surprising, they master the risk budgeting exercise, and they understand risk controls.
For the Caisse, the Alpha of the regression is close to -1% per year and it is statistically significant. Nobody in the private market could sustain such long period of negative alpha. Nobody could manage a portfolio with 25% more risk than what is requested by the client.
In my report, I also talk about the QPP contribution rate. When Canada created the CPP in the mid-60s, Quebec said “Hey, we want to better manage our own fund.” That led to the creation of the Caisse de Depot and it was an excellent decision as the returns of the QPP were much better because they were managed professionally in a diversified portfolio (vs provincial bonds for the CPP). Unnoticed by everyone in Quebec, the contribution rate started to increase in 2012 and will continue to increase up until 2017 at which time Quebecers will pay 9% more than the rest of Canadians for basically the same pension plan (some tiny differences). And the explanation is this negative alpha.
I also explained that with proper risk budgeting techniques at all levels, the Caisse could deliver an extra $5 billion with 20% less risk! Instead of increasing the contribution rate of all CDPQ clients QPP, REGOP, etc., we could have kept them at the same level or lower. And part of that extra $5B return every year would find its way into the Quebec government coffer through reduced contributions and higher taxes (the higher contributions to QPP, Regop, etc. that Quebecers pay are tax deductible…)
For how long are we going to avoid looking at proper attribution? For how long are we going to forfeit this extra $5B per year in extra returns?
I shared Dominic’s study with Roland Lescure, the CIO of the Caisse, who shared this with me:
You are right, we have significantly lowered leverage at the Caisse since 2009. Leverage is now solely used to fund part of our real estate portfolio and the (in)famous ABCP portfolio which will be gone by 2016. As you rightly point out, most Canadian pension funds use leverage to different degrees. Further, we also have significantly reduced risk by focusing our investments on quality companies and projects, which are less risky than the usual benchmark-driven investments. And those investments happen to have served us well as they did outperform the benchmarks significantly in 2014. You probably have all the details for each of our portfolios but I would point out that our Canadian equity portfolio outperformed the TSX by close to 300 bps. And the global quality equity portfolio did even better.
I thank Dominic Clermont and Roland Lescure for sharing their insights. Dominic raises several excellent points, some of which are politically sensitive and to be honest, hard to verify without experts really digging into the results of each and every large Canadian pension. Also, that increase in the contribution rate for public sector workers is part of tackling Quebec’s pension deficits, slowly introducing more risk-sharing in these plans.
Again, this is why even though I’m against an omnipotent regulator looking at systemic risks at pensions, I believe all of Canada’s large pensions need to provide details of their public and private investments to the Bank of Canada and we need to introduce uniform comprehensive performance, operational and risk audits at all of Canada’s major pensions.
These audits need to be conducted by independent and qualified third parties that are properly staffed to conduct them. The current auditing by agencies such as the Auditor General of Canada is simply too flimsy as far as I’m concerned, which is why we need better, more comprehensive audits across the board and the findings should be made public for all of Canada’s large pensions.
And let me say while the Caisse has clearly reduced leverage since the ABCP scandal which the media keeps covering up, it is increasingly shifting into private markets, introducing more illiquidity risk that can come back to haunt them if global deflation takes hold.
As far as stocks are concerned, I see a melt-up occurring in tech and biotech even if the Fed makes a monumental mistake and raises rates this year (read the latest comment by Sober Look to understand why market expectations of Fed rate hikes are unrealistic). It will be a rough and tumble year but my advice to the Caisse is to stay long U.S. equities (especially small caps) and start nibbling at European equities like Warren Buffett. And stick a fork in Canadian equities, they’re cooked!
Will the liquidity and share buyback party end one day? You bet it will but that is a topic for another day where I will introduce you to a very sharp emerging manager and his team working on an amazing and truly unique tail risk strategy.
As far as U.S. equities, I think the Caisse needs to stop indexing and start looking at ways to take opportunistic large bets using some of the information I discussed when I covered top funds’ Q4 activity. This would be above and beyond the information they receive from their external fund managers.
By the way, if you compare the Caisse’s top holdings to those of the Bill and Melinda Gates Foundation, you’ll notice they are both long shares of Waste Management (WM), one of the top-performing stocks in the S&P 500 over the last year.
I’ll share another interesting fact with you, something CNBC’s Dominic Chu discussed a few days ago. Five stocks — Apple (AAPL), Amazon (AMZN), Biogen Idec (BIIB), Gilead (GILD), and Netflix (NFLX) — account for all of the gains in the Nasdaq this year. If that’s not herd behavior, I don’t know what is!!
Lastly, it takes a lot of time to write these in-depth comments and you won’t read this stuff in traditional media outlets which get hung up on headline figures and hardly ever dig deeper. Please take the time to contribute to my blog on the top right-hand side, or better yet, stop discriminating against me and hire the best damn pension and investment analyst in the world who just happens to live in la belle province!
Below, Michael Sabia, CEO of the Caisse, discusses the Caisse’s 2014 results with TVA’s Pierre Bruneau (in French). Michael also appeared on RDI Économie last night where he was interviewed by Gérald Filion. You can view that interview here and you can read Filion’s blog comment here (in French).
Also, some food for thought for the Caisse’s real estate team. A new report from Zillow shows that rents across the U.S. are increasing, and not just in the expected regions of New York City, San Francisco and Boston. Overall, rents increased 3.3% year-over-year as of January. But many cities outpaced that, including Kansas City, which saw rent grow more than double the national average, jumping 8.5% year-over-year. St. Louis saw rent increase by 4.5% over the same period. Rents in Detroit grew by 5.0% and rents in Cleveland grew by 4.2%.
Photo credit: “Canada blank map” by Lokal_Profil image cut to remove USA by Paul Robinson – Vector map BlankMap-USA-states-Canada-provinces.svg.Modified by Lokal_Profil. Licensed under CC BY-SA 2.5 via Wikimedia Commons – http://commons.wikimedia.org/wiki/File:Canada_blank_map.svg#mediaviewer/File:Canada_blank_map.svg
Deprecated: Function get_magic_quotes_gpc() is deprecated in /home/mhuddelson/public_html/pension360.org/wp-includes/formatting.php on line 3712
Deprecated: Function get_magic_quotes_gpc() is deprecated in /home/mhuddelson/public_html/pension360.org/wp-includes/formatting.php on line 3712
Deprecated: Function get_magic_quotes_gpc() is deprecated in /home/mhuddelson/public_html/pension360.org/wp-includes/formatting.php on line 3712