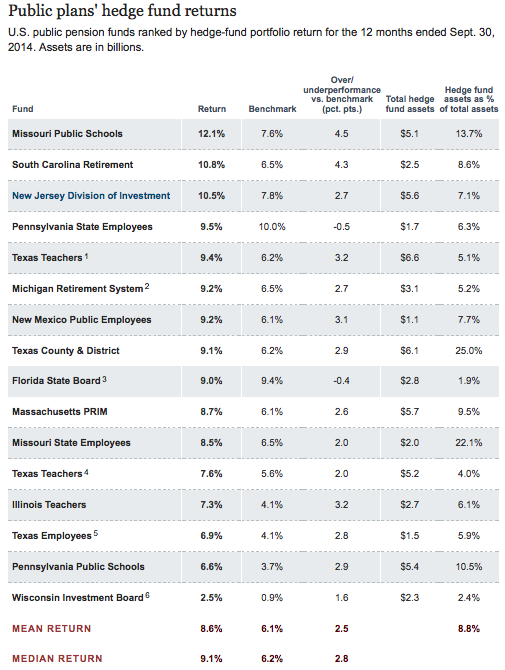
Here’s a chart listing the strongest-performing hedge fund portfolios over the 12 month period ended September 30, 2014.
You can also see whether or not the portfolio outperformed its benchmark, and the percentage of system assets dedicated to hedge funds.
Chart credit: Pensions & Investments
Here’s what I honestly don’t understand. If the goal is to get returns that aren’t necessarily high but that have a low correlation with the stock market, then why pay 125 basis points per year for hedge funds when bonds accomplish that goal even more effectively at a cost of 17 basis points per year? (The investment cost figures come from CEM Benchmarking’s excellent report “Asset Allocation and Fund Performance of Defined Benefit Pension Funds in the United States Between 1998-2011,” sponsored by NAREIT and available at https://www.reit.com/investing/industry-data-research/research/cem-benchmarking-defined-benefit-pension-fund-research.)
Over the period 1/94-11/14, the Dow Jones Credit Suisse Hedge Fund Index provided returns averaging 8.47% per year with 7.13% volatility for a Sharpe ratio of 0.825; the Barclays Capital U.S. Aggregate Bond Index provided returns averaging 5.69% with 3.63% volatility for a slightly higher Sharpe ratio of 0.854. But hedge funds had a fairly high correlation with the Dow Jones U.S. Total Stock Market Index at 0.613, while the bond market had essentially no correlation at 0.025; beta was 0.29 for hedge funds compared to 0.01 for bonds. In terms of “adjusting to reflect zero beta returns,” hedge funds had a lower alpha (5.40% per year vs 5.62%), lower Jensen’s alpha (0.031 vs 0.212), and lower Treynor ratio (20 vs 477).
So exactly what is it about hedge funds that makes them worth paying an extra 108 basis points every year?
That’s a serious question. Anybody have a serious answer?
Deprecated: Function get_magic_quotes_gpc() is deprecated in /home/mhuddelson/public_html/pension360.org/wp-includes/formatting.php on line 3712