Cutting Investment Fees – A Key To Secure Retirement?

flying one hundred dollar billsCharles D. Ellis wrote a thoughtful article in the Financial Analysts Journal recently about the hard choices that people– and institutions – must face sooner than later regarding retirement and pension systems.

One of the main facets of the article’s thesis:

We need to make hard choices on how much to save, how long to work, how to invest, and how much to draw from our savings for spending in retirement.

The article is full of great discussion on these points. After someone stops working, a big part of their financial security stems from controlling costs – not just living expenses, but investment expenses, as well.

From the article:

Most investors somehow believe that fees for investment management are low. Fees are not low. Here’s why: By convention, fees are shown as a percentage of the assets, say, just 1%. But that’s seriously misleading. The investor already has the assets, so the manager’s fee should be stated as a percentage of the benefit (i.e., returns).

If returns are 7%, then the same fee in dollars is 15% of returns. And because index funds deliver the full market return with no more than the market level of risk for a fee of 0.1%, the real cost of active management is the incremental cost as a percentage of the incremental benefit of active management. That’s why the true cost of active management is not 1% or even 15%. Because the average active manager falls short of his chosen benchmark, the average fee is more than 100% of the true net benefit.

Increasingly, investors are learning that one way to reduce costs—and increase returns—is to save on costs by using low-cost index investments, particularly with their 401(k) or other retirement plans.

How your retirement funds are invested is important because many of those dollars are invested for a very long time—20, 40, even 60 years.

The article, titled “Hard Choices: Where We Are”, is available for free from the Financial Analysts Journal.


Photo by 401kcalculator.org
Study: Has a 400 Percent Increase in Alternatives Paid Off For Pensions?

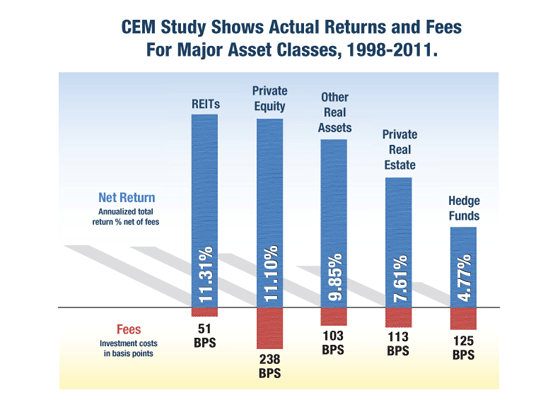
CEM ChartA newly-released study by CEM Benchmarking analyzes investment expenses and return data from 300 U.S. defined-benefit plans and attempts to answer the question: did the funds’ reallocation to alternatives pay off?

The simple answer: the study found that some alternative classes performed better than others, but underscored the point that “costs matter and allocations matter” over the long run.

In the chart at the top of this post, you can see the annualized return rates and fees (measured in basis points) of select asset classes from 1998-2011.

Some other highlights from the study:

Listed equity REITs were the top-performing asset class overall in terms of net total returns over this period. Private equity had a higher gross return on average than listed REITs (13.31 percent vs 11.82 percent) but charged fees nearly five times higher on average than REITs (238.3 basis points or 2.38 percent of gross returns for private equity versus 51.6 basis points or 0.52 percent for REITs). As a result, listed equity REITs realized a net return of 11.31 percent vs. 11.10 percent for private equity. Net returns for other real assets, including commodities and infrastructure, were 9.85 percent on average. Net returns for private real estate were 7.61 percent, and hedge funds returned 4.77 percent. On a net basis, REITs also outperformed large cap stocks (6.06 percent) on average and U.S. long duration bonds (8.97 percent).

Many plans could have improved performance by choosing different portfolio allocations. CEM used the information on realized net returns to estimate the marginal benefit that would have resulted from a one percentage point increase in allocation to the various asset classes. Increasing the allocations to long-duration fixed income, listed equity REITs and other real assets would have had the largest positive impacts on plan performance. For example, for a typical plan with $15 billion in assets under management, each one percentage point increase in allocations to listed equity REITs would have boosted total net returns by $180 million over the time period studied.

Allocations changed considerably on average from 1998 through 2011. Of the DB plans analyzed by CEM, public pension plans reduced allocations to stocks by 8.5 percentage points and to bonds by 6.6 percentage points while increasing the allocation to alternative assets, including real estate, by 15.1 percentage points. Corporate plans reduced stock allocations by 19.1 percentage points while increasing allocations to fixed income by 10.5 percentage points (consistent with a shift to liability driven investment strategies), and to alternative assets by 8.6 percentage points. For the DB market as a whole, allocations to stocks decreased 15.1 percentage points; fixed income allocations increased by 4.3 percentage points; and allocations to alternatives increased by 10.8 percentage points. In dollar terms, total investment in alternatives for the 300 funds in the study increased from approximately $125 billion to nearly $600 billion over the study period.

The study’s author commented on his findings in a press release:

“Concern about the adequacy of pension funding has focused attention on investment performance and fees,” said Alexander D. Beath, PhD, author of the CEM study. “The data underscore that when it comes to long-term net returns, costs matter and allocations matter.”

[…]

“Many pension plans could have improved performance by choosing different allocation strategies and optimizing their management fees,” Beath continued. “Listed equity REITs delivered higher net total returns than any other alternative asset class for the fourteen-year period we analyzed, driven by high and stable dividend payouts, long-term capital appreciation and a significantly lower fee structure compared to private equity and private real estate funds.”

Read the study here.

Newspaper: Report on Canadian Investment Expenses “Misses the Point”

Canada map

Last week, Pension360 covered a report questioning the Canada Pension Plan’s new investment strategy, which had led to a more than 100 percent increase in investment expenses since 2006.

But one newspaper, the Hamilton Spectator, says the report missed the point entirely. From the Hamilton Spectator editorial:

Rousing displays of verbal fireworks could not conceal the study’s failure to find out what Canadians need to know. […] The country needs to know whether private-sector plans or the public plan is a more efficient way of saving for retirement.

The authors found the government collects the contributions to the Canada Pension Plan and pays out the pensions, for an administrative cost of around $550 million a year. The government recovers that cost by skimming an administrative charge off the contributions. If the CPP Investment Board counted that cost as part of its operating costs, those costs would be $550 million higher.

But we need to know if the government’s costs for collecting contributions and mailing out cheques are out of line with operators of private-sector pension plans. The study’s authors make no inquiry on that point.

A more useful study would produce evidence both from the public and private spheres. That study would have to be written by authors who gather the evidence first and then draw their conclusions. The study published last week seems more like the work of an agency with a narrow agenda — what you might call a self-serving bureaucracy.

The report, released last week, found the Plan’s investment expenses had increased from $600 million or 0.54% of assets in 2006 to $2 billion or 1.15 per cent of its assets in 2013.