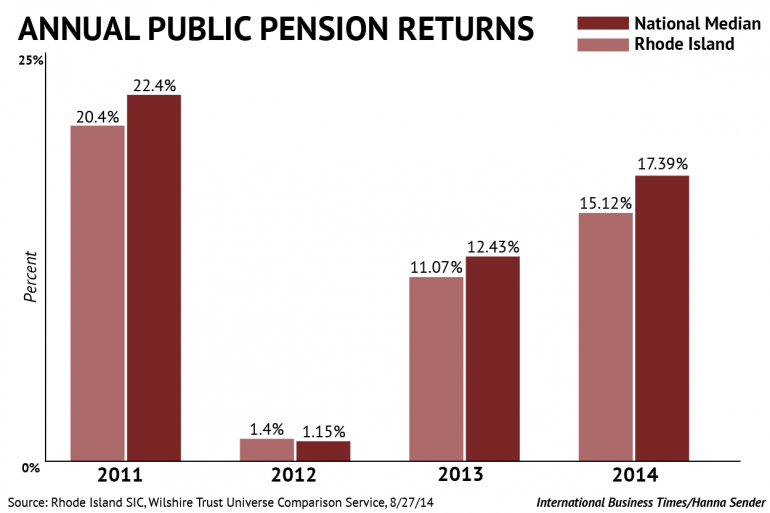
The chart above illustrates how Rhode Island’s pension fund returns stack up against the typical plan – Rhode Island has underperformed relative to the national median in three of the last four years.
The chart below illustrates the actual cost of that performance:
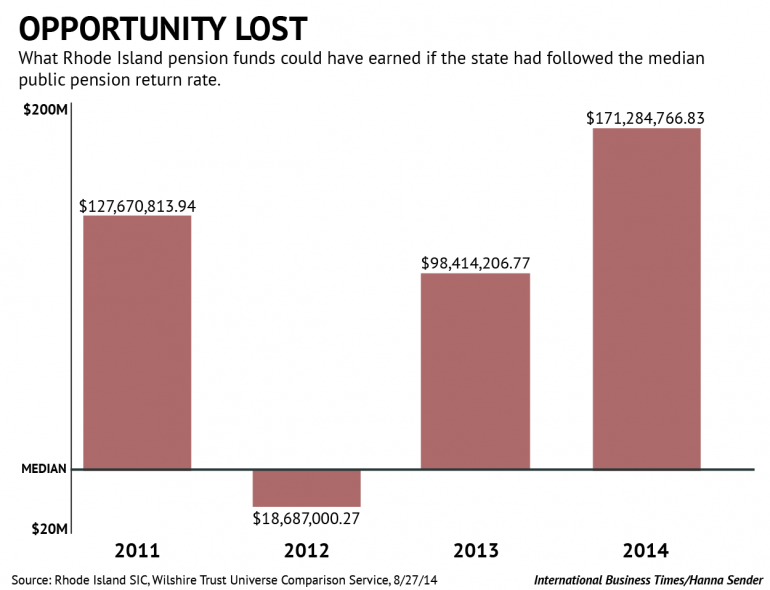
Chart credit goes to the International Business Times.