Do older Americans have enough money saved to last through retirement? It’s a question asked often, but a definitive answer is hard to come by.
An article published in the October issue of Pension Benefits takes aim at answering that question using a metric called the Retirement Readiness Rating (RRR), developed by the Employee Benefit Research Institute.
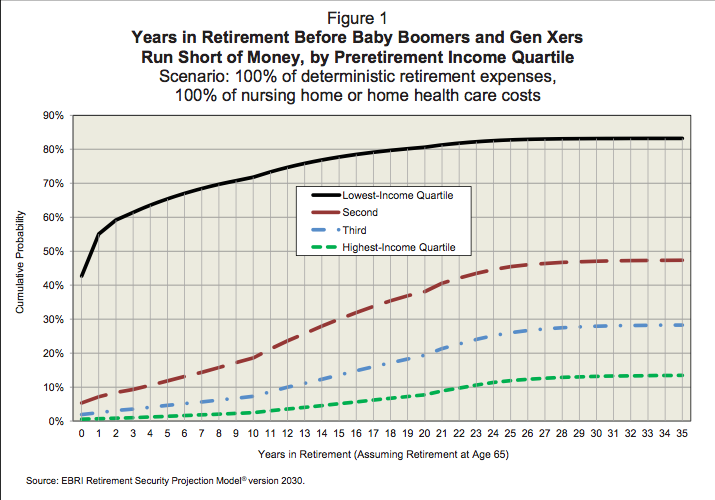
The analysis, which originally appeared in the EBRI’s June newsletter, was conducted using several different scenarios; the first scenario and the resulting analysis can be seen in Figure 1, above. More on the results:
Figure 1 shows the results assuming that 100 percent of the simulated deterministic expenses are met; in other words, 100 percent of the average expenses (based on post-retirement income) for components likely to be encountered on a regular basis (e.g., food, housing, transportation). In addition to these relatively predictable expenses, the stochastic costs arising from nursing home and home health-care expenses are assumed to be covered in years when the model simulates their existence.
Note that in Figure 1, while 5 percent or less of those in the second-, third-, and highest-income quartiles would run short of money in the first year of retirement, more than 2 in 5 (43 percent) of those in the lowest-income quartile would, based on deterministic and stochastic costs. Moreover, by the 10th year in retirement (assuming retirement at age 65), nearly 3 in 4 (72 percent) of the lowest-income quartile households would run short of money, while fewer than 1 in 5 (19 percent) of those in the second-income quartile would face a similar situation. Only 7 percent of those in the third-income quartile and 2 percent of those in the highest-income quartile are simulated to run short of money within a decade.
By the 20th year in retirement (again, assuming retirement at age 65), more than 4 in 5 (81 percent) of the lowest income quartile households would run short of money, compared with 38 percent of those in the second-income quartile that would face a similar situation. Only 19 percent of those in the third-income quartile and 8 percent of those in the highest-income quartile are simulated to run short of money by the twentieth year. These values continue to increase until all households either run short of money or there are no surviving retirees. By the 35th year in retirement (age 100, assuming retirement at age 65), 83 percent of the lowest-income quartile households would run short of money and almost half (47 percent) of those in the second-income quartile would face a similar situation. Only 28 percent of those in the third-income quartile and 13 percent of those in the highest income quartile are simulated to run short of money eventually.
A summary of the full results:
The results presented in Figures 1 through 6 show that the years of retirement before Baby Boomer and Gen Xer households run short of money vary tremendously by:
- Preretirement-income quartile.
- The percentage of average deterministic costs assumed paid by the household.
- Whether or not nursing home and home health-care expenses are included in the simulation.
However, even when 100 percent of average deterministic costs are paid by the household and nursing home and home health-care expenses are included (Figure 1), only the households in the lowest-income quartile eventually end up with a majority of the households running short of money during retirement.
Each of the six analyses with results presented in Figures 1 through 6 show the same stark conclusion: The lowest preretirement income quartile is the cohort where the vast majority of the shortfall occurs, and the soonest. When nursing home and home health-care expenses are factored in (Figures 1, 3 and 5), the number of households in the lowest-income quartile that is projected to run short of money within 20 years of retirement is considerably larger than those in the other three income quartiles combined. Indeed, as the results across multiple scenarios and assumptions show, the lowest-income quartile is the most vulnerable, while longevity and long-term care are the biggest risk factors across the entire income spectrum.
The full analysis, including all six scenarios, can be read in the October issue of the Pension Benefits, or the EBRI’s June newsletter.