Norway’s Giant Fund Buckles in Q2?

640px-Flag_of_Norway,_state.svg

Leo Kolivakis is a blogger, trader and independent senior pension and investment analyst. This post was originally published at Pension Pulse.

Camilla Knudsen of Reuters reports, Norway’s $870 bln fund sinks to first loss in three years:

Norway’s $870 billion sovereign wealth fund reported its first quarterly loss in three years on Wednesday, hauled down by sliding bond and stock markets.

The world’s richest sovereign wealth fund owns about 1.3 percent of all global equities and has massive government and corporate bond holdings, so its performance and decisions are closely followed by investors across the world.

It lost 73 billion Norwegian crowns ($8.8 billion) in the second quarter – representing a negative return of about 1 percent on its investments. That was the first drop the fund had seen since the same period of 2012 – and a dramatic reversal from the record 401 billion crown gain in January-March this year.

The value of the fund’s bond holdings – which account for about a third of its portfolio – fell by 2.2 percent in the April-June quarter as yields increased in its main markets, including the United States, Europe and Japan.

Its equities – which make up the bulk of its investments – lost 0.2 percent, hit by a decline in U.S. stocks, which outweighed gains in Asia and flat returns in Europe.

“The fund’s results during the last several years have come from a rise in stock markets and the simultaneous fall in long-term yields, in fact in all yields,” said Trond Grande, deputy CEO of the fund, which invests Norway’s oil and gas wealth.

Many investors expect the U.S. Federal Reserve to start raising interest rates later this year, which would push yields higher.

“It would very quickly hit the value of our bonds … In the short run it would necessarily have a negative development for the fund,” Grande said, adding that coupon payments made from bonds could be reinvested at a higher yield if rates rose.

He declined to comment on his expectations for the global economy or on the investment plans of the fund, which holds $167,000 for each of Norway’s 5.2 million people.

The value of the wealth fund’s real estate investments – which account for just a fraction of its portfolio – rose 2 percent in the second quarter.

A strengthening of the Norwegian crown reduced the value of the fund by a further 53 billion crowns in the period, but this is not counted as part of its negative return as currency movements are expected to even out over time.

Currency movements had led to an increase of 175 billion crowns in the previous quarter for the fund, which makes its investments in foreign currencies but assesses its own size in crowns.

The fund has cut its share of bond investments to 34.5 percent of its portfolio, from 35.3 percent at the end of March. Its equity investments have risen to 62.8 percent, from 62.5 percent; while its property holdings have increased to 2.7 percent, from 2.3 percent.

Yngve Slyngstad, the CEO of the giant fund, spoke with Bloomberg’s Manus Cranny in Oslo and stated that monetary policy and China are the biggest issues facing Norway’s sovereign wealth fund.

Interestingly, Bloomberg reported on Tuesday that despite the selloff, the world’s biggest sovereign wealth fund isn’t about to lose its faith in China and it’s prepared to increase its investment there:

The $870 billion fund, built on Norway’s oil riches, says the current selloff and policy shifts from China’s leadership won’t change its long-term view on the world’s second-biggest economy, where it’s prepared to increase its investment.

“We’re following the movements there and we see that they are steadily opening and taking steps in the direction of opening up the markets,” Ole-Christian Bech-Moen, chief investment officer of allocation strategies, said on Tuesday in an interview during a conference in Oslo. “We’re thinking long-term, so the short-term policies there and policy shifts — it’s not that important for the longer-term strategic thinking.”

After years of lobbying, the Norwegian wealth fund this year had its quota for investments in Chinese A shares lifted to $2.5 billion from $1.5 billion. It had about $27 billion invested in China and Hong Kong at the end of last year.

If China’s market becomes even more liberalized, “we know that it will be a big allocation” for the fund, Bech-Moen said.

The People’s Bank of China’s surprise decision last week to allow markets greater sway in setting the currency’s level triggered the biggest selloff in 21 years and roiled global markets. Since then, 10 emerging market nations have said they are particularly at risk since China’s yuan devaluation.

Henry Paulson

Norway’s wealth fund held 9.6 percent of its stocks and 12.9 percent of its bonds in emerging markets at the end of March. It has been increasing its investments in those markets as it tries to escape dwindling returns in the developed world.

“Capturing broader aspects of global growth is something where we have a very long horizon, so it’s not really governed by short-term fluctuations,” Bech-Moen said.

Chinese officials have a tough job in confronting the economic slowdown and undertaking market reform, former U.S. Treasury Secretary Henry Paulson said at a conference in Oslo hosted by Norway’s oil fund.

President Xi Jinping “understands the importance of fixing the economy,” Paulson said. “He has unleashed a massive reform agenda that goes way beyond the economy. It goes to every part of China — economic, social and political.”

Writing on pensions, I understand all about very long investment horizons but when you see the wealthiest investors in China bailing out of the market, you have to wonder whether the bursting of the China bubble has way more to go before things stabilize there (history has taught us that much).

At this writing, U.S. stocks are trading sharply lower on Wednesday morning after a wild trading session in China sent other Asian markets down and as Wall Street awaits the release of the Federal Reserve’s July meeting minutes.

Everybody is worried about China and the Fed, including the bond king who came out once again after his dire warning to basically state the Fed would be making a mistake hiking rates with junk bonds at a four year low:

DoubleLine Capital’s co-founder Jeffrey Gundlach warned on Tuesday that it might be premature for the U.S. Federal Reserve to raise interest rates next month, given junk-bond prices are hovering near four-year lows.

“To raise interest rates when junk bonds are nearly at a four-year low is a bad idea,” Gundlach said in a telephone interview.

Gundlach, widely followed for his prescient investment calls, said if the Fed begins raising interest rates in September, “it opens the lid on Pandora’s Box of a tightening cycle.”

Gundlach said the selling pressure in copper and commodity prices driven by worries over China’s growth outlook “should be a huge concern. It is the second-biggest economy in the world.”

Last year, Gundlach correctly predicted that U.S. Treasury yields would fall, not rise as many others had forecast, because inflationary pressures were non-existent and technical factors, including aging demographics, were at play.

The Los Angeles-based DoubleLine Capital had $76 billion in assets under management as of June 30.

The DoubleLine Total Return Bond Fund (DBLTX.O), DoubleLine’s largest portfolio by assets and run by Gundlach, had positive inflows in July.

The Total Return fund attracted a net inflow of $390.4 million last month, compared with $81.7 million in June. It has $47.2 billion in assets under management and invests primarily in mortgage-backed securities.

I’m more convinced than ever the Fed has a deflation problem and it will be making a monumental mistake if it raises rates this year (Note: The Fed may have just gotten a red light for rate hike). The Wall Street green shoots keep telling us that everything is fine but I prefer reading Warren Mosler’s take on economic data, including his latest on U.S. housing starts and the Fed white paper, building permits, transport charts, Japan trade.

Stock markets around the world are doing what they always do, overreacting to news. Yesterday I noted that sentiment on emerging markets has reached a record low and I can pretty much say the same thing about the U.S. stock market where according to the Bank of America Merrill Lynch’s latest global fund manager survey, overall exposure to the US stock market moved to a 14% net underweight position, a level last seen in 2007.

The bears on Wall Street and around the world are growling, presenting some excellent buying opportunities for Norway’s sovereign wealth fund and other large global investors.

I continue to buy the big dips in biotech (IBB and XBI) and tech (QQQ) and steer clear of energy (XLE), mining and metals (XME) including gold (GLD) and pretty much anything related to commodities (GSC), emerging markets (EEM) and China (FXI). You can trade these sectors but be nimble and TAKE profits quickly.

Admittedly, my personal investment horizon is much shorter than that of pension or sovereign wealth funds, and part of me really loves trading these crazy schizoid markets. 

As far as Norway’s sovereign wealth fund, its fortunes are inexorably tied to public markets. That is good and bad. During a real bear market where stocks and bonds get killed, it will grossly underperform its large rivals, including Canada’s two biggest pension funds which are diversified across public and private markets.

What is good about being tied to public markets? One word: liquidity. Some of Canada’s sharpest pension minds, like Ron Mock and Jim Keohane, have sounded the alarm on illiquid alternatives which include real estate, private equity and infrastructure. 

Of course, when it comes to performance, the proof is always in the pudding. Over a ten year period, Canada’s top large pensions have mostly outperformed Norway’s sovereign wealth fund, which goes to show you that diversifying intelligently (more direct investments, less fund investments) into private markets pays off when managing a huge portfolio. 

Still, Norway is doing a lot of great things that others, including Canada’s large pensions aren’t doing. CBC News just reported that the Norwegian fund giant is putting a premium on ethical investing and this helps bolster returns. While I don’t doubt this, I caution investors and tree hugging vegans around the world, especially in British Columbia, to recognize the limits of so-called “ethical” investing.

There is one area where Norway is killing Canada, and I’m not talking about oil policy where we basically bungled things up again (learned nothing from our past mistakes). I’m talking about pension governance. I think we can learn a lot from Norway on this front.

In particular, Norway’s giant fund has great transparency and a solid governance model. I have long argued that Canada’s large public pensions need to improve on both of these fronts. I long to see the day where we cut the Office of the Auditor General and even the Office of the Superintendent of Financial Institutions out of auditing and supervising public and private pensions and put that responsibility squarely in the hands of the Bank of Canada like they do in Norway, the Netherlands and Denmark.

Canada’s pension plutocrats won’t like that last recommendation and they will tell you that keeping the government out of pensions is always the best governance, which is true, but I think things have to change a little to restore some balance in the way we govern our large public pensions and introduce more rigorous accountability and transparency in the way these large pensions invest and compensate their senior investment staff.

Hope you enjoyed reading this comment. Please remember to click on the ads and donate or contribute via PayPal on the top right hand side (of PensionPulse.com). As for Norway’s giant fund, feel free to contact me at LKolivakis@gmail.com as I’d love to work with you on all sorts of projects, including hedge funds, private equity, real estate, infrastructure and anything else.

Trouble At Canada’s Biggest Pensions?

496px-Canada_blank_map.svgLeo Kolivakis is a blogger, trader and independent senior pension and investment analyst. This post was originally published at Pension Pulse.

Barbara Shecter of the National Post reports, CPPIB eyeing global investments, even as ‘difficult’ conditions push fund to losses:

The Canada Pension Plan Investment Board is continuing to pursue global investments, including a large transaction in Asia, even though declines in major global equity and fixed income markets hammered the returns of the CPP Fund in the first quarter of the fiscal year.

A $4-billion increase in assets came entirely from $4.2 billion in CPP contributions as the fund posted a net investment loss of $0.2 billion during the period that ended June 30.

“In a quarter where everything essentially went against us, to be flat is… a pretty good outcome,” said Mark Wiseman, chief executive of CPPIB, which invests funds that are not needed by the Canada Pension Plan to pay current benefits.

“Amid these difficult market conditions, our private investment programs generated meaningful income, exemplifying the benefits of building a resilient, broadly diversified portfolio.”

Wiseman said his team is able to continue pursuing investments around the world, including one he described as “a large transaction is Asia,” because the fund’s size and scale and diversification, and a long-term investment horizon, provide stability in these volatile times.

“Our comparative advantages, given the choppy market conditions, are coming to the fore,” he told the Financial Post.

“At some level, volatility is our friend. In conditions like this, we are able to transact and continue to diversify and build our portfolio [when] others are running in the opposite direction.”

At the end of the quarter, public equities accounted for just shy of 32 per cent of the asset mix, with fixed income at about 33.5 per cent.

Private equities sat at just under 18 per cent, with the balance in real assets (real estate and infrastructure).

The CPP Fund’s 10-year annualized real rate is return, accounting for the impact of inflation, is 5.8 per cent.

In 2012, Canada’s Chief Actuary said the Canada Pension Plan would be sustainable for 75 years at current contribution rates with a real rate of return of 4 per cent.

Returns over the past decade are “comfortably above” that assumption, CPPIB said Friday, adding long-term returns are a “more appropriate measure of CPPI’s performance than returns in any given quarter or single fiscal year.”

Also, Judy McKinnon and Rita Trichur of the Wall Street Journal report, Canada’s largest pension fund posts small negative return:

Canada Pension Plan Investment Board, the country’s largest pension fund, on Friday reported a negative net return of 0.1% for its fiscal first quarter, citing in part declines in major global stock and bond markets.

CPPIB said it had C$268.6 billion ($205.6 billion) of net assets under management in the quarter ended June 30, up slightly from C$264.6 billion at the end of its previous quarter on March 31.

CPPIB said the C$4 billion increase included a net investment loss of C$200 million, after taking into account its operating costs, and C$4.2 billion in pension contributions.

“Going forward, we are expecting to continue to see volatility in markets generally, in both fixed-income market and equity markets,” said chief executive Mark Wiseman. But that turbulence is also creating potential opportunities for CPPIB, he said.

“From an investment perspective, volatility is our friend,” Wiseman said, noting CPPIB’s scale and long-term investment horizon mean the organization can “continue to invest and diversify the portfolio across asset classes and across geographies”.

It has already been a busy year on the investment front. In June, CPPIB announced plans to acquire General Electric’s unit in private equity lending, which includes Antares Capital, in a deal worth about $12 billion. CPPIB has said Antares Capital will keep its name and operate as a stand-alone business.

The transaction is on track to close during the current quarter, said Wiseman. “With the Antares transaction, we’re extremely pleased with the quality of the team that we’ve acquired.”

Earlier in the day, CPPIB said its gross investment return in the period was flat at 0.01%.

CPPIB measures its performance on an annual basis against an internal benchmark based on returns from a mix of asset classes, but it doesn’t provide quarterly returns for that index.

In its latest fiscal year ended in March, it posted an 18.3% net return, outperforming its internal benchmark return of 17%.

CPPIB, which focuses on investments that generate steady returns over the long term to help fund its pension liabilities, said it had more than 25 investments during the latest quarter.

I’ve already covered CPPIB’s acquisition of GE’s private equity lending business and think it’s a great deal, perhaps the deal of the century for a large Canadian pension fund (it has risks but the benefits far outweigh these risks over the very long run).

CPPIB has been very busy lately, buying five U.K. student residences with 2,153 beds for $672 million and venturing into the Malaysian real estate business for the first time. The IPO of Neiman Marcus, a U.S. luxury retailer, will also help Canada’s largest pension fund boost its return.

As far as the slight negative quarterly return, I simply don’t pay attention to this stuff. It’s trivial and meaningless for a large pension fund that has a very long investment horizon and long dated liabilities.

I can say the exact same thing for the Caisse which recently reported its mid-year update as of June 30th, posting a six-month return of 5.9%. The media loves making a big stink on these quarterly and mid-year updates but I ignore them for the simple reason that what matters is fiscal or calendar year results over a one and more importantly, four, five and ten year period.

And Michael Sabia, the Caisse’s CEO, warned of global turbulence ahead as the fund topped benchmarks in first half:

The Caisse de dépôt et placement du Québec exceeded its six-month benchmark portfolio return in the first half of 2015, but says it sees warnings of a stormy global economic environment in the months and years to come.

“We see signs that cause us to wonder… about whether a slowdown in global growth is what we expect to see,” CEO Michael Sabia said Friday following an update of the Caisse’s yearly activities to June 30.

“It’s not time to go to the beach,” Sabia said. “It’s time to double down, lift our game, continue to outperform our reference portfolio and continue to try to do better on the market.”

Quebec’s largest institutional investor generated $1.7 billion more than projected in the first six months of 2015, with a 5.9 per cent return on clients’ funds, compared to its 5.2 per cent benchmark portfolio return.

The fund’s assets sit at $240.8 billion, up from $225.9-billion at the end of 2014.

“We think against a pretty volatile backdrop the portfolio of La Caisse has performed well with a substantial amount of value added,” said Sabia.

The CEO said he can’t predict whether this performance will continue over the second half of 2015 in an environment of growing economic and geopolitical risks.

“In the near term almost anything can happen. Markets fluctuate and this can happen on the basis of any number of things, some of them quite unseen at any particular time,” he said. “We’re not in the position to predict on a short-term basis and we don’t try to.”

The Caisse manages several large Quebec pension plans, and Sabia said it targets about a six per cent return to its depositors.

It reported a 10.2 per cent return over the past four years, adding $75 billion to its assets.

Sabia said meeting that same level of growth could prove challenging in the next four years, citing concerns over high asset valuation, a lack of central bank stimulus options and heavy indebtedness among Western countries.

“After such a long period of expansion in the market, how long is this going to continue?” he said.

“When we look across the global economy, we don’t see any big engines capable of accelerating global growth.”

Sabia says that although even the United States is showing only moderate economic growth, the Caisse is inline to make substantial investments there involving government on a municipal, state and federal level.

“I won’t go further than to say we are very upbeat about the opportunities we have in the U.S.,” he said.

The Caisse reports that over the past six months, each asset class in its portfolio generated a return above its index.

Equities returned 7.8 per cent with net investment results of $8.3 billion, while fixed income had a 2.7 per cent return, generating $2.1 billion.

Inflation-sensitive investments recorded a 4.6 per cent return, generating net investment results of $1.6 billion.

In the first half of the year, the Caisse acquired stakes in the Eurostar high-speed rail operator, and in Southern Star Central Corp., a natural gas pipeline operator in the U.S.

It also invested in the U.K. telecoms sector, SterlingBackcheck, one of the world’s largest background screening companies, and SPIE, a European engineering firm.

In Quebec, the Caisse invested in companies including Cirque du Soleil and Logistec, and launched an infrastructure subsidiary to work on projects in the Montreal area.

“The duck may look calm going across the lake, but I can assure you that there is a great deal of activity underway under the waterline,” said Sabia.

I like Michael Sabia, he’s a smart guy and hard worker who really learned a lot over the last five years, but I ignore his big calls on stocks and bonds. I can say the same thing about Leo de Bever, AIMCo’s former CEO, who is a very smart guy but made terrible market calls, especially on bonds.

To be fair to both of them, even the “best and brightest” continue to be confounded by the bond market because they simply don’t understand the Fed’s deflation problem or where the real risks lie in the bond market going forward. They all need to listen to the bond king’s dire warning and ignore hedge fund gurus claiming bonds are the bigger short.

In fact, some see oil heading as low as $15-$20 a barrel in the months ahead and the yield on U.S. Treasuries dropping a low as 1% on further yuan devaluation, fueling the rout in commodity prices and driving investors to seek safety in U.S.bonds.

If that happens, stocks are going to get killed this fall. One well-known market timer, Tom McClellan, sees stocks set up for ‘ugly decline’ as early as Thursday. I sent that article to a buddy of mine who replied: “What time on Thursday???”

It never ceases to amaze me how people love making big bullish or bearish calls and most of the time, they’re dead wrong. Can oil head lower? Sure, I’m not bullish on oil, commodity, energy or emerging markets but sentiment is so negative that they can all easily bounce from these levels. Are bond yields heading lower? Who knows? We are one financial crisis away from a crash in stocks, deflation coming to America and negative bond yields there (never say never!!).

But I’m not particularly worried right now because there is plenty of global liquidity to drive all risk assets much higher from these levels regardless of what’s going on in the global economy.

Will it be volatile? You bet it will but there will be plenty of opportunities for smart investors to capitalize in private and public markets. I just finished writing a long comment going over the holdings of top funds for Q2 2015 discussing some opportunities in specific stocks. People need to stop worrying and start digging and working hard to find hidden gems.

Anyways, enough ranting on stocks, bonds and commodities. Getting back to Canada’s large public pension funds, I’m not overly worried even if there is global turbulence ahead. I can say the same thing about most Canadian defined benefit plans which returned -1.6% in the second quarter, the first decline in investment returns since the second quarter of 2012, according RBC Investor & Treasury Services’ quarterly survey states.

The key difference between the Caisse, CPPIB, OTPP, PSP, etc. and other Canadian DB pension funds is they are better positioned to weather the storm ahead, if one is to develop. Their fortunes aren’t tied to the rise and fall of oil prices or the S&P/TSX because they are (for the most part) globally diversified across public and private markets.

Got that? So please stop reading too much into quarterly, mid-year or even annual results. They are pretty much irrelevant in the longer scheme of things.


Photo credit: “Canada blank map” by Lokal_Profil image cut to remove USA by Paul Robinson – Vector map BlankMap-USA-states-Canada-provinces.svg.Modified by Lokal_Profil. Licensed under CC BY-SA 2.5 via Wikimedia Commons – http://commons.wikimedia.org/wiki/File:Canada_blank_map.svg#mediaviewer/File:Canada_blank_map.svg

Beware of Small Hedge Funds?

Graph With Stacks Of Coins
Editor’s note: This post from Pension Pulse isn’t about pensions; but since hedge funds and institutional investing are so closely intertwined, we’ve decided to post this interesting piece regardless.


Leo Kolivakis is a blogger, trader and independent senior pension and investment analyst. This post was originally published at Pension Pulse.


Mark Fahey of CNBC reports, Small hedge funds aren’t as great as they say:

You’ve probably heard the conventional wisdom: Smaller, younger hedge funds are more nimble, and tend to bring better returns than their bulky, aging cousins.

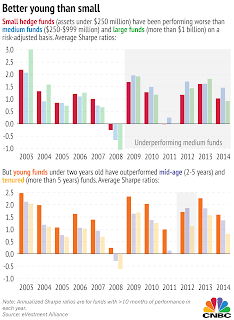
But youth and size are not the same thing. About 85 percent of young funds—under 2 years old—manage less than $250 million in assets, but only about 14 percent of all small funds are young. That’s down from 42 percent of all small funds about a decade ago.

That may sound like simple semantics, but it matters because “young” funds and “small” funds don’t behave the same when it comes to returns. While young funds do, in fact, tend to outperform older funds, small funds haven’t been doing as well in recent years.

Looking at Sharpe ratios, a measure of risk-adjusted return, small hedge funds have been underperforming medium-sized funds for the last six years, a stark difference from strong returns before the financial downturn, according to an analysis of thousands of reporting funds by eVestment Alternatives Research (click on image):

“Everyone thinks that small funds perform well, but we see that disappearing over time,” said Peter Laurelli, vice president of research at eVestment.

What changed? Both the market environment and the strategy composition of the different categories shifted over that time, said Laurelli. Most of the early outperformance from the smaller funds came from emerging market strategies, where smaller funds were more likely to be focused on specific countries and to operate in more volatile environments. Later, small funds also outperformed in managed futures and macro strategies, he said.

“The post-financial crisis environment has seen each of these groups go through periods of difficulty, driven by their respective market environments,” said Laurelli.

Investors seem to be catching on. The proportion of small hedge funds has been falling, and investors seem to be favoring medium and large funds. New funds also tend to be larger, with the percentage of young funds that are medium-sized growing from less than 8 percent before the financial crisis to about 13 percent in 2013.

As for young hedge funds, they tend to have healthy returns because by definition they have a timing advantage—funds tend to be formed at times that are advantageous for their specific strategies. For example, a crop of successful securitized credit strategy funds was founded after the recession in response to opportunities in that area, and while all types of funds saw good returns for that type of strategy at that time, those returns will raise the “young fund” category because they were created at that time.

The biggest funds are big for a reason

The 30 largest, most prominent hedge funds at the end of 2014 performed better than any group aside from the average young fund. Last year, those funds returned a little more than 6 percent—missing the young funds by just 5 basis points.

The biggest funds together manage nearly $450 billion, yet was one of the only groups—again, along with young funds—to end in the black in 2011. Even in 2008, the largest funds limited their losses to an average of 0.65 percent, despite the added difficulty of moving their much larger investments.

About 10 of those 30 largest funds use macro or managed futures strategies, that led to healthy returns around the time of the financial crisis. Eight used credit strategies, which were strong after the crisis. Others were multistrategy or distressed and special situation investing, said Laurelli. Few are pure equity products, so the losses of 2008 and 2011 harmed the largest group the least.

And of course, big funds don’t usually get big by being bad at what they do.

“Prominent funds become prominent because their performance warrants growth of assets,” said Laurelli. “Performance is a mix of opportunity, the ability to attract and pay the talent to exploit opportunity, and the scale needed to profitably exploit opportunities.”

Return isn’t everything

While some small funds have struggled to raise capital and gone bust, some have had solid returns and will continue to attract interest, said Amy Bensted, head of hedge fund products at Preqin, an alternative assets intelligence firm.

Preqin classifies funds with $100 million or less in assets as small, but the company sees similar results to eVestment, said Bensted. Preqin hasn’t looked specifically at the top 30, but the firm generally finds that it’s the middle range—funds with $100 million to $500 million in assets—that perform the best in returns.

But there is more to hedge fund investing than simply looking at average returns or risk-adjusted returns, she said.

“It’s not just about returns and long-term gains, it’s more about the types of investors who may be interested in these funds,” said Bensted, “Maybe they’re looking for a true hedge fund with a unique strategy, or they might have lower fees.”

It’s difficult to categorize funds or judge them on one metric alone. Size and age are just two of many ways to break apart the market.

“Every one is unique, and size is part of that uniqueness,” said Bensted. “It’s an interesting way to look at it, and a good way to frame the market.”

Stephen Weiss, managing partner for Short Hills Capital Partners and a CNBC contributor, said that his “fund of funds” strongly prefers smaller funds that are one or two years old and run by managers with a “strong pedigree.”

“However, it takes a lot more work to find these funds,” said Weiss. “Larger funds have more assets because endowments and pensions—institutional investors—have a bogie of 5 to 8 percent return and a self-imposed mandate to not lose their jobs by recommending a non-brand name fund.”

Smaller, younger managers are more driven by returns because they haven’t made their fortunes yet, said Weiss. Categorical returns are averages, so if an investor can pick the right small funds, they can still pay off.

The article above delves deeply into a topic that I’ve covered over the years. My own thinking has evolved on the subject as I’m ever more convinced this is a brutal environment for all hedge funds and only the strongest will survive.


This is why I keep warning Soros wannabes to really rethink their plan to start a hedge fund, unless of course they are his protégé, in which case the chances of success are infinitely higher.

What has changed? First and foremost, the institutionalization of hedge funds has fundamentally altered the landscape and there are reasons why the biggest hedge funds keep growing bigger:

  • The biggest hedge funds are typically trading in highly scalable, liquid strategies and are a better fit for large global pension and sovereign wealth funds that prefer allocating to a few large “brand name” hedge funds than to many small hedge funds. It’s not just about reputation or career risk, it’s also about allocating human resources to perform due diligence on all these smaller funds and monitor them carefully.
  • The biggest hedge funds have the resources to hire the very best investment, back office and middle office personnel. Not only do they attract top talent away from banks and smaller hedge funds but also from large, rival large hedge funds. More importantly, they’re able to hire top compliance and risk officers, which helps them pass the due diligence from large institutions.

Having said this, there are pros and cons to investing with the ‘biggest and the best,” especially in Hedgeland where useless consultants typically recommend the hottest hedge funds to their clueless clients, even though these are the funds they should be avoiding at all cost.

What are the other problems with the biggest hedge funds? I outline a few below:
  • The big hedge funds attract billions in assets and collect 1.5% to 2% in management fee no matter how well or how poorly they perform. This incentivizes them to focus more on asset gathering and less on performance. Collecting a 2% management fee is fine when you’re starting off a hedge fund; not so much when you pass the $10 billion mark in AUM (and some think even less than that).
  •  Large hedge funds are typically led by larger-than-life personalities who don’t give even their large investors the time of day. You’re never going to get to meet Ray Dalio, Ken Griffin, or many other big hedge fund hot shots when conducting your on-site visits (I was lucky to meet Ray Dalio because I was accompanied by the president of PSP at the time and insisted on it).
  • This means you won’t gain the same rapport and knowledge leverage that you can gain by investing in a smaller manager who is more open to cultivating a deeper relationship with a long term investor.
But smaller hedge funds are still courted by the top funds of funds that are more focused on performance (they have to be to charge that extra layer of fees) and are looking to grow their assets and find the next Dalio, Griffin, Soros, Tepper, etc.


If I was a large sovereign wealth fund or pension fund, I would definitely give a $500 million, $1 or even $2 billion  mandate to one or a few well established fund of funds like Blackstone, PAAMCO, or even someone more specialized in a specific strategy or sector, to fund emerging managers (separate account where I am the only investor). I would negotiate hard on fees but be very fair as you want to see emerging talent succeed and thrive in order to eventually shift them into your more established external managers’ portfolio.


Still, there are risks to this strategy. Quebec’s absolute return fund which was established to help emerging managers here ended up being a total flop. To be brutally frank, most hedge funds in Quebec and the rest of Canada stink and would never be able to compete with funds in New York, London or Chicago (to be fair, the hedge fund ecosystem stinks in Quebec and is marginally better in the rest of Canada. Moreover, overzealous regulators here make it virtually impossible to open a hedge fund, which is another story you don’t want me to get started on).


It’s also a tough environment for top established American hedge funds, which makes it even harder to succeed in these brutal Risk On/ Risk Off markets where deflation and China fears loom large. The rout in commodities has hit a lot of big players very hard, including ‘God-trader’ Andy Hall whose fund, Astenbeck Capital Management, lost $500M in the month of July (see below). Also, not surprisingly, China focused hedge funds have been decimated.


Do me a favor, please go back to read an older comment of mine on the rise and fall of hedge fund titans as well as a more recent comment on alpha, beta and beyond.  Also go read my comment on Ron Mock’s harsh hedge fund lessons to gain more insights in how to properly invest in hedge funds.

Full Steam Ahead on the Ontario Retirement Pension Plan?

496px-Canada_blank_map.svg

Leo Kolivakis is a blogger, trader and independent senior pension and investment analyst. This post was originally published at Pension Pulse.

Ashley Csanady of the National Post reports, Ontario to start implementing new pension plan in 2017, with full roll-out expected by 2020:

Ontario’s pension plan will come in waves, but all employees in the province will be covered by a workplace plan or the new provincial design by 2020, Premier Kathleen Wynne said Tuesday.

The Ontario Retirement Pension Plan will start requiring contributions from the largest employers, those with more than 500 workers, in 2017. However, employers who already offer mandatory, registered pension coverage will be exempt if their plan is deemed comparable to the ORPP by the province. Companies whose pension plans are currently optional for employees or who don’t meet that threshold will have until 2020 to bring their plans up to snuff.

After the announcement, she admitted that the Liberals have no idea how much it will cost to run the new pension plan.

“We don’t know what those costs will be yet,” she said.

The pension plan was a major plank of the Liberals 2014 budget and the subsequent election campaign. Though some details were announced at the time, Tuesday marked the first time the province clarified who the ORPP would capture and how it plans to phase in the plan.

In 2022, people who are 65 or older can start drawing on the ORPP, though how much they will be eligible for is not yet known. Workers, whether part-time or full-time, will start contributing at age 18 and can do so until they turn 70. The Canada Pension Plan, upon which the ORPP is modelled, exempts workers who make less than $3,500 a year, but the province is still consulting on that minimum threshold.

The goal is to bridge the gap for the two thirds of Ontarians without a workplace pension plan and the half of workers who contribute to neither a workplace plan nor an RRSP. The hope is 3.5 million Ontarians will be part of the plan by 2020 and all workers will be enrolled either in the provincial option or a workplace pension.

The plan will collect 1.9 per cent of a workers’ income up to $90,000 from both employers and employees to a total of 3.8 per cent, or a combined total of $3,420 a year. That means those making $90,000 a year would pay just under $33 a week into the ORPP if they don’t have a comparable workplace plan and their employers would match that. That province believes that will result in over $12,800 a year in retirement income once the plan is fully implemented and if they pay into the ORPP for 40 years.

People making $45,000 a year, would pay just over $16 a week into the plan, which would also be matched by employers for an annual combined contribution of $1,710. Estimates suggest they will receive over $6,400 a year in retirement income once the plan is fully implemented and if they pay into the ORPP for 40 years.

The contributions will likely be slightly lower once an exemption for the first few thousand dollars of income earned is accounted for, as is the case with the Canada Pension Plan

Administration costs for the plan will likely run between $130 a person and $200 a person, officials said.

Employers with mandatory defined benefit plans — plans that offer a set amount of retirement income that remains constant over employees’ lifetimes — that save at least 0.5 per cent will be exempt. Employers with defined contribution plans — plans that don’t offer a set amount of income but are instead open to the fluctuations of the market — must sock away at least 8 per cent of employees’ income. All employees in a company must be enrolled for it to be exempt. Employers with optional plans will have until 2020 to make them mandatory or they will have to join the ORPP.

The costs to employers who must enroll will be 1.9 per cent of their total payroll.

Richard J. Brennan of the Toronto Star reports, Wynne calls proposed Ontario pension plan ‘right thing to do’:

Premier Kathleen Wynne is standing firm on bringing in a made-in-Ontario pension in the face of widespread criticism.

After details for the proposed Ontario Retirement Pension Plan ‎(ORPP) were revealed Tuesday, Wynne said something has to be done for the two-thirds of workers in the province who don’t have a workplace pension.

“I believe it is the right thing to do,” Wynne said of the plan, noting that two our of three Ontario workers have no pension plan other than the Canada Pension Plan (CPP), which she says is just not enough at an average of $6,900 a year.

Her biggest critic, federal Conservative Leader Stephen Harper, who was campaigning in the GTA, said the proposed pension plan was a job-killing tax.

“That’s a huge tax hike. It’s not a good idea. It’s a bad thing for the middle class and it’s obviously a bad thing as well for jobs. And it’s a bad thing for our economy,” said Harper in Markham.

The Canadian Federation of Independent Business, representing small- and medium-sized business, is also fiercely critical of the Ontario pension plan, predicting it will result in job loss.

Wynne acknowledged the missing piece remains how much it could cost to create the ORPP.

But she said she is determined to ignore the critics and push ahead on the plan that would see all Ontario employees belong to a workplace pension plan of one kind or another in five years.

Companies that already have comparable workplace pension plans will be exempt from the ORPP, which is to be phased in by 2020. Like the Canada Pension P‎lan, the ORPP would be equally funded by both employers and employee — 1.9 per cent from each.

ORPP details show that a person making $45,000 a year will pay $2.16 a day. It will go up to $4.50 a day for someone making the maximum of $90,000 annually.

The plan, according to a Liberal government release, will be fully implemented by 2020 and affect about 3.5 million in Ontario, with benefits starting to be paid out two years later. Participants must be 65 or older before they can collect.

According to the ORPP details, a person making $45,000 a year for 40 years will receive $6,410 a year for life, compared to $12,815‎ a year for life for the top $90,000 earners — equal to about a 15 per cent return after four decades.

If approved, the ORPP would begin in 2017 with large-size employers — 500 or more employees — without registered workplace pension plans. Medium-size employers with 50 to 499 employees without registered workplace pension plans would start to contribute in 2018. The plan will not include small-size employers until 2019.

Harper has refused to increase CPP benefits as requested by several provincial leaders; he has also has decided the federal government will not administer the plan for Ontario.

He said he was “delighted” his government’s refusal to co-operate with the plan is making it harder for the Ontario government to implement the program.

Wynne said Harper, whose federal pension would be about $140,000 a year, has decided there isn’t a need across Canada for supplementary provincial pension plans “and is now standing in the way of trying to help us implement this plan.”

Federal Liberal Leader Justin Trudeau has said if his party were to form a government it will look at expanding the CPP, along the lines of what Wynne is suggesting.

Harper was not alone in his condemnation of the ORPP, which would be phased in over the next five years for firms that don’t have a pension plan at all, or one that is not comparable to the ORPP. Business leaders say ‎many companies simply can’t afford it and that if it is forced on them it could mean layoffs.

“I have to make it clear that most small- and medium-size businesses don’t have a pension plan right now, not because they don’t want to have one, it’s because they can’t afford it. And I think that is a point this government has missed since the very beginning of this conversation,” said Plamen Petkov, CFIB’s Ontario vice-president.

Petkov said employers will be left with having to leave the province altogether or reduce staff in order to cover their pension contributions.

Progressive Conservative MPP Julia Munro said people are going to lose their jobs because of this pension plan.

“Small businesses in particular will be forced to reduce their staff to compensate for the mandatory contribution of nearly 4 per cent (in total) from each employer and employee,” Munro said, who further criticized the government for not producing a cost/benefit analysis.

Allan O’Dette, president and CEO of the Ontario Chamber of Commerce, said the OCC remains concerned the ORPP in its current form “will have a negative impact on business competitiveness.”

Sid Ryan, president of the Ontario Federation of Labour, said the fact the ORPP is not going to be universal — unlike the CPP — will cause no end of problems, including driving up the cost of administration.

“The magic of the CPP is that it is universal — all workers are covered — and as a result of that you have low administration costs. What was announced today is a mish-mash of that,” he told reporters.

Meanwhile, the Canadian Labour Congress is calling for a doubling of the CPP benefits.

By the numbers

— With files from Bruce Campion-Smith

For the 3.5 million workers expected to participate in the Ontario Retirement Pension Plan:

  • An employee making $45,000 a year will contribute $2.16 a day or $788.40 a year.
  • An employee paid $70,000 a year will contribute $3.46 a day or $1,262.90 a year.
  • An employee earning the maximum of 90,000 annually will shell out $4.50 a day or $1,642.50 annually.

Payouts after 40 years:

  • An employee making $45,000 a year would receive $6,410 a year for life.
  • An employee with a salary of $70,000 a year would receive $9,970 a year for life.
  • An employee making $90,000 a year would receive $12,815‎ a year for life.

When fully implemented the ORPP would bring in about $3.5 billion annually.

Lastly, Robyn Urback of the National Post reports, Kathleen Wynne doubles down on pension plan that will cost TBD and solve (insert):

On Tuesday morning, Ontario Premier Kathleen Wynne stood in front of a group of reporters as they asked her questions about the new provincial pension plan, to be rolled out in phases between 2017 and 2020. The premier had just delivered a near 20-minute monologue about the accolades of the new program, despite the fact that many of the specifics will surely depend on who forms the new federal government after the October election. Indeed, it probably would have made more sense to give an update in the fall, but why put off until tomorrow when you can remind Ontarians that Stephen Harper is “standing in the way” of comfortable retirement today?

Tuesday marked the first time Wynne clarified some of the exemption rules of the Ontario Retirement Pension Plan (ORPP), which the Liberals campaigned on during last year’s provincial election. As of 2017, companies with more than 500 employees will be required to start contributing to the plan, unless they already offer comparable mandatory defined benefit or contribution pension plans. Those without will be required to contribute 1.9 per cent of each employee’s salary up to $90,000, which combined with an equal contribution from employees will mean a total of 3.8 per cent. According to briefing documents, those earning $45,000 would contribute $2.16 per day to the plan, whereas an employee earning the maximum amount — $90,000 —would contribute $4.50 per day. By the time the program is fully implemented to include all employers by 2020, the government expects 3.5 million Ontarians will be covered by the ORRP.

Naturally, the briefing left some questions unanswered: How will the ORPP incorporate self-employed Ontarians? Would the Ontario government scrap the program if the federal government expands CPP? And what will be the administrative costs of rolling out the program?

The answer, in each case, was essentially a shrug: “We are working to make this a low-cost plan,” the premier said, conceding that at this point she can’t speak to numbers. That is, of course, quite rich from a government lecturing Ontarians about improperly managing their finances. Pressed on how the plan might affect employees who might not be able to afford setting aside an extra 1.9 per cent, Minister of Finance Charles Sousa cited the billions in unused RRSP contributions as evidence that people can save for retirement, but are choosing not to.

In fact, there is ample evidence that Ontarians are much better prepared for retirement than the government would have us believe, between CPP, Old Age Security, RRSPs, savings and private equity. Indeed, a June report from the C.D. Howe Institute suggested that most of us can retire comfortably on less than the traditional 70 per cent of pre-retirement income target, considering that many of our daily budget strains (childcare, mortgage payments, etc). settle by the time we reach retirement age.

What’s more, another recent study from the Fraser Institute found that forced government savings plans might very well offset Canadian households’ private savings after looking at CPP investment in the 1990s and finding that with every percentage point increase in CPP contributions, private savings dropped by 0.895 percentage points. This suggests that Ontario’s forced savings plan won’t actually ensure that Ontarians save more, but simply that they save differently. It also just so happens to ensure that the $3-billion or so to be collected annually by the time the ORPP is fully implemented in 2020 will kept in the hands of the government, allowing for “new pools of capital for Ontario-based project such as building roads, bridges and new transit,” as stated in last year’s budget. Oh yes, and for your retirement.

In sum, the Ontario government is excitedly moving forward on a plan that will cost X, to solve Y, which will cost you 1.9 per cent of your annual income. The government may or may not abandon the plan if the federal government expands CPP, but hey, we might be able to finance new roads! Ontarians cannot afford to retire, but they can afford another forced savings plan. Any questions?

Yes, I have a question. When did the National Post become a preeminent authority on good pension policy? Citing research from right-wing think tanks like the Fraser Institute and the C.D. Howe Institute which are funded by Canada’s powerful financial services industry isn’t exactly what I call objective reporting. It’s sloppy and heavily biased reporting.

Don’t get me wrong, I’m sure the affluent, pro-Conservative readers of Ontario who read the National Post as if it were the bible of reporting lap this stuff up. Unfortunately, it’s inaccurate at best, complete scaremongering rubbish at worst.

This is all part of a series of dumb attacks on the ORPP which fail to delve deeply into why absent an enhanced CPP initiative, which will never happen under Harper’s watch, the ORPP makes good sense from a pension and economic policy perspective:

[…] there is no denying that Ontario has the best pension plans in the world. Go read my comment on Ontario Teachers’ 2014 results as well as that on the Healthcare of Ontario Pension Plan’s 2014 results. There are a lot of talented individuals working there that really know their stuff and you have to pay up for this talent. The same goes for CPPIB, OMERS, and the rest of the big pensions in Canada. If you don’t get the compensation right, you’re basically condemning these public pensions to mediocrity.

What else does the National Post comment miss? It completely ignores the benefits of Canada’s top ten to the overall economy but more importantly, it completely ignores a study on the benefits of DB plans and conveniently ignores the brutal truth on DC plans.

But the thing that really pisses me off from this National Post editorial is that it fails to understand costs at the CPPIB and put them in proper context relative to other global pensions and sovereign wealth funds with operations around the world and relative to the mutual fund industry which keeps raping Canadians on fees for lousy performance. It also raises dubious and laughable points on the Caisse and QPP with no proper assessment of the success of the Quebec portfolio or why our large public pensions can play an important role in developing Canada’s infrastructure.

But the National Post is a rag of a national newspaper and I would expect no less than this terrible hatchet job from its editors. The only reason I read it is to see what the dimwits running our federal government are thinking. And from my vantage, there isn’t much thinking going on there, just more of the same nonsense pandering to Canada’s financial services industry and the brain-dead CFIB which wouldn’t know what’s good for its members if it slapped it across the face (trust me, I worked as a senior economist at the BDC, the CFIB is clueless on good retirement policy and many other policies).

I might come off like an arrogant jerk but I stand by every word I wrote in that comment. Canada has some of the best defined-benefit plans in the world and instead of building on their success and enhancing the retirement security for millions of Canadians, our Prime Minister is pandering to the financial services industry and lying by claiming the contributions from enhancing the CPP or initiating an ORPP is a “tax” and jobs killer”.

Canada is going to experience a major economic slowdown in the next couple of years. The unemployment rate will soar but it has nothing to do with ORPP or enhancing the CPP. It’s called the business cycle and the fact that Canadians were living in dreamland for so many years benefiting from China’s insatiable appetite for our resources and the U.S. recovery after the 2008 crisis.

But the good times are over for Canada. Canadians are in for a very rude awakening as the China bubble bursts and China’s big bang wreaks havoc on our stock market and overvalued real estate market. I’ve actually been short the loonie since December 2013 and think it can head lower, especially if global growth doesn’t pick up in the months ahead.

So why would you want to enhance the CPP or introduce the ORPP in this wretched environment? The answer is that stock market and economic fluctuations aside, bolstering our retirement system makes good sense from an economic perspective over the very long-run. It will actually help create jobs as workers retire and receive a secure payment for life, consume more, pay more in sales taxes and don’t require government assistance to get by.

Is the ORPP a perfect solution? Of course not. I want to see the federal government wake up already and enhance the CPP for all Canadians. I want to build on the success of our existing large defined-benefit plans and provide better coverage for all Canadians, just like we do in healthcare and education.

As far as the three parties running now, in terms of pension policy, I don’t like any of them. The Liberals want to introduce “voluntary CPP” which is a stupid idea (make it mandatory!) and the NDP are fuzzy when it comes to mandatory, enhanced CPP and want to increase corporate taxes to fund their social initiatives at the worst possible time.

I also think the Liberals are stupid for wanting to get rid of TFSAs or clawing back on them. TFSAs are far from perfect but they’re popular with Canadians, especially doctors, lawyers, accountants and other hard working professionals who have no retirement plan and need to save more. I personally love the TFSA and the Registered Disability Savings Plan (RDSP) which Jim Flaherty introduced back in 2008 (God bless him).

But now that Jim Flaherty departed us, there isn’t much economic thinking going on with the Tories. In fact, the Conservatives pledged Wednesday to let first-time buyers withdraw as much as $35,000 from their registered retirement savings plan accounts to buy a home, in a yet another election move aimed at the housing market. Great move, have people take out money from their RRSPs to buy an overvalued house right before the great Canadian real estate bubble bursts!


Photo credit: “Canada blank map” by Lokal_Profil image cut to remove USA by Paul Robinson – Vector map BlankMap-USA-states-Canada-provinces.svg.Modified by Lokal_Profil. Licensed under CC BY-SA 2.5 via Wikimedia Commons – http://commons.wikimedia.org/wiki/File:Canada_blank_map.svg#mediaviewer/File:Canada_blank_map.svg

Analysis: AIMCo Gains 9.9% Net in 2014

496px-Canada_blank_map.svg

Leo Kolivakis is a blogger, trader and independent senior pension and investment analyst. This post was originally published at Pension Pulse.

The Alberta Investment Management Corporation (AIMCo) recently announced a total fund net return of 9.9% in 2014:

The net of fees return was 11.2% for pension and endowment Clients, and 4.4% for government and specialty fund Clients.

Annually, the board and management agree on active return targets consistent with top quartile return on active risk. Since 2009, AIMCo has earned its Clients value add of $2.5 billion net of fees. In 2014, AIMCo earned a net of fees return of 9.9%, underperforming its active return target of 10.5% by 0.6% or $401 million net of fees.

Public markets investments performed strong with public equities contributing $369 million and fixed income adding $167 million to value add. Private market investments also demonstrated strong returns in certain asset classes with real estate generating $145 million.

The primary driver of underperformance in 2014 may be attributed to losses incurred by AIMCo’s global tactical asset allocation strategy and the revaluation of certain prior year investments. In addition, certain illiquid asset classes lagged behind the very strong performance of their listed benchmarks, a not unexpected outcome given the diversification rationale for investment in these asset classes.

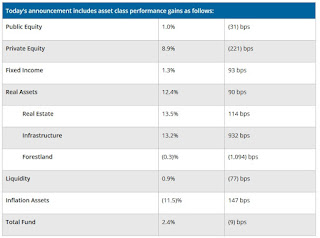
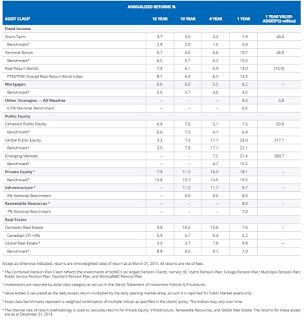
AIMCo’s investment performance by calendar year (net of fees) is broken down in the table below (click on image):

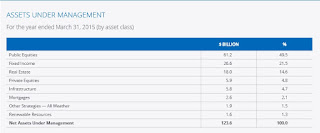
Also, here is a snapshot of the big picture of AIMCo’s asset mix, assets under management and net investment results as of December 31, 2014 (click on image):

AIMCo’s 2014 Annual Report is available on their site here. I strongly recommend you read it carefully to get a better understanding of the results across public and private markets. Also worth reading are the Chair and CEO messages.

I will bring your attention to this passage from Kevin Uebelein, AIMCo’s new CEO since January 2015, in his message (added emphasis is mine):

Our commitment is to be both client dedicated and performance driven in all aspects of our business, always seeking continuous incremental improvement. Ultimately it is to be truly world-class, not only in benchmarking our returns but in all facets of our business compared to the best asset managers wherever they may exist. We will do this in a spirit of collaboration internally with all employees, and with our clients and all stakeholders.

AIMCo remains committed to seek out the best investment opportunities for our clients with careful consideration of their unique liability and risk-return profiles. We will strive to be a transparent and trusted advisor and will work closely to understand client needs. We will match those needs to our capabilities and ensure that long-term stakeholder obligations are satisfied.

Similar to the Caisse, AIMCo has many clients but the points I highlighted have to do with benchmarking returns and liability-driven investments. Benchmarking in particular is one area where AIMCo excels relative to most of its larger Canadian peers. It’s not perfect, however, but still better than most other large pension funds and there is definitely no free lunch in private market benchmarks.

On benchmarks, AIMCo states the following (page 33):

AIMCo’s performance benchmarks measure what our Clients could earn by passively implementing their investment policy with bond and stock market index investments. The incremental return above what markets provide measures the contribution of active management, referred to as value add.

The selection of appropriate benchmarks is important in investment management. Done properly, it ensures alignment of the Client’s risk and return objectives to the investment strategy of the asset manager. Public market investment benchmarks comprise all of the attributes of an unbiased effective measure – transparent, stable, and investable. Illiquid asset classes are more difficult to benchmark given the lack of readily available comparison data for the physical assets invested in and due to the fact that by their very nature, these investments are expected to provide an illiquidity premium relative to the nearest listed proxy.

AIMCo and its Clients work together to identify the most appropriate benchmarks against which performance should be measured

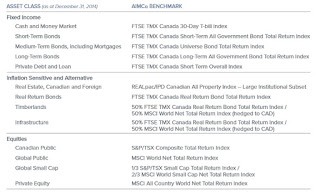
Here are AIMCo’s benchmarks in all asset classes (click on image below from page 33):

As you can see, public market benchmarks are pretty much self-explanatory but in private markets, there is no free lunch anywhere (unlike places like PSP Investments which needs to work on its private market benchmarks, especially in real estate and natural resources).

Are AIMCo’s private market benchmarks perfect? No, they’re not, but the truth is private market benchmarks aren’t perfect anywhere. In previous conversations I had with Leo de Bever (AIMCo’s former CEO) on this topic, he admitted it’s tough to benchmark private markets but he agreed with me that the benchmarks should reflect the opportunity cost of not investing in public markets plus a spread to compensate for leverage and illiquidity.

Of course, when it came down to it, Leo de Bever never recommended adding a spread to AIMCo’s Private Equity benchmark (MSCI All Country World Net Total Return Index) and stated to me that “in the long-run it all works out as there are some years where public markets surge and others where they grossly under-perform private markets.”

If you ask me, I actually think PSP finally got its Private Equity benchmark right (Private Equity Fund Universe and Private Equity cost of capital) but some will even argue that this doesn’t reflect the true opportunity cost of investing in an illiquid investment.

The point I’m trying to make is some large Canadian funds take benchmarking their private market portfolios much more seriously than others and this is important from a risk and compensation point of view.

Anyways, enough on benchmarking private markets, maybe I will delve deeper into this topic and tie it to compensation in a future comment on Canada’s pension plutocrats.

Here are the overall results for AIMCo for all its portfolios from page 34 of the Annual Report (click on image):

Keep in mind these are annualized net returns as of December 31st, 2014 for public and private market portfolios. I think this is one reason why AIMCo waits till June/ July to report its results as there is always a lag of a quarter for private market investments (valuation lag).

I emailed AIMCo’s CEO, Kevin Uebelein, to discuss there results. Kevin didn’t speak to me on AIMCo’s 2014 results (to be fair, he wasn’t the CEO at the time) but he was very responsive and directed me to Dénes Németh, Manager, Corporate Communication at AIMCo.

I actually sent an email to Dénes, Kevin and Leo de Bever asking these questions:

1) Why exactly did AIMCo underperform its benchmark in 2014? What repricing of which assets?
2) Performance of private equity is NOT clear. On one table (p. 34) with all the asset classes it is 11.9% vs benchmark of 13.5% but then on p. 38 it says private equity returned 21.7% outperforming its benchmark by 8.1%…very confusing!
3) AIMCo is now making opportunistic real estate investments outside of Canada (small percentage) but using a Canadian AAA real estate index?

Copied Leo de Bever here as he was the CEO in 2014. Also, with Alberta oil revenues falling fast, how will this impact AIMCo?

Dénes was kind enough to follow up with these answers:

1) Why exactly did AIMCo underperform its benchmark in 2014? What repricing of which assets?

As discussed elsewhere in the Annual Report, AIMCo’s illiquid investment classes such as Infrastructure, Timber and Private Equity use Public Market benchmarks. Combined, these asset classes account for approximately $7.5 billion or 9% of our AUM. The Public Market benchmarks experienced strong performance during the relevant period, resulting in a corresponding underperformance of the illiquid asset classes. We are continually reviewing our methods of measuring performance and in 2015 have undertaken a review of certain of our illiquid benchmarks in collaboration with our clients.

AIMCo holds illiquid investment in certain insurance-linked assets. These assets were revalued in 2014 for a number of reasons, including updated information, better clarity on the application of accounting principles and the increasing sophistication of the relevant market.

2) Performance of private equity is NOT clear. On one table (p. 34) with all the asset classes it is 11.9% vs benchmark of 13.5% but then on p. 38 it says private equity returned 21.7% outperforming its benchmark by 8.1%…very confusing!

The $3.3 billion Private Equity asset class noted on Page 34 is an aggregated total comprising three main strategies – Private Equity Investments, as well as, AIMCo’s Relationship Investing and Venture Capital. The aggregate return of 11.9% does not provide a true picture of how each strategy performed, so to provide the reader additional detail, we chose to break out the MD&A by specific strategy on Page 39. I appreciate how it can be confusing, so in future reports we will consider adding a line to clarify.

3) AIMCo is now making opportunistic real estate investments outside of Canada (small percentage) but using a Canadian AAA real estate index?

We invest opportunistically in real estate in foreign markets as an alternative to investing in Canada. We use the REALpac / IPD Canadian All Property Index – Large Institutional Subset to judge the performance of those foreign assets against what we would have earned had we instead invested within Canada.

A few comments on those answers. Basically, Relationship Investing and especially Venture Capital really underperformed, hurting the overall (aggregate) net returns in Private Equity. I was never a big fan of Canadian venture capital (or VC in general) and have seen huge losses in this space while working as a senior economist at the Business Development Bank of Canada. I even told Leo de Bever about this and he agreed with me that VC is a tough gig but “AIMCo was investing in late stage VC”.

As for Real Estate, I appreciate Dénes’s response but I caution stakeholders everywhere, Canadian residential and commercial real estate is in for a long, tough slug now that Canada’s crisis is well underway and comparing opportunistic foreign real estate investments to the REALpac / IPD Canadian All Property Index – Large Institutional Subset just doesn’t make sense.

Now to be fair, AIMCo’s foreign real estate holdings make up roughly 20% of the Real Estate portfolio, and most of this isn’t opportunistic real estate (it is core) but this is still something to keep in mind when gauging whether the real estate benchmark appropriately reflects the underlying risks of the Real Estate portfolio (another example of how private market benchmarks have to be reevaluated ever so often to determine whether they reflect real risks of underlying portfolio).

I will leave it up to my readers to carefully read AIMCo’s 2014 Annual Report to get more information on their public and private investments as well as other information.

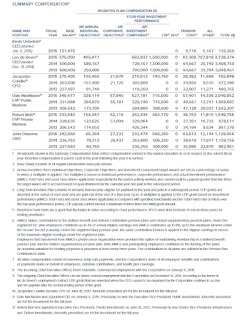
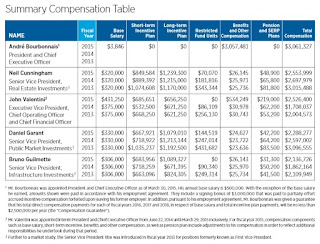
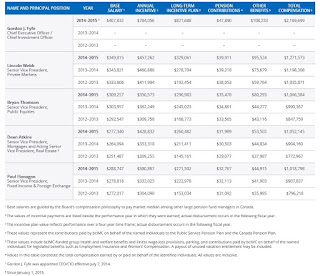
In terms of compensation, the table below from page 69 provides a summary for the compensation of AIMCo’s senior officers (click on image):

As you can see, Leo de Bever, AIMCo’s former CEO tops the compensation at $3,728, 374. Over the last three calendar years (2012, 2013, 2014), he made just shy of $10 million, which is considerably more than I thought he earned when I wrote the list of highest paid pension fund CEOs. Dale MacMaster, who is now AIMCo’s CIO, enjoyed the second highest total compensation in 2014 of $2,049, 952.

Again, keep in mind compensation is based on rolling four-year returns over benchmarks. The fact that AIMCo underpeformed its benchmark in 2014 will have an impact on future compensation. Also, as I stated above, there’s no free lunch for AIMCo’s private markets managers, which makes beating their overall benchmark that much more difficult.

Let me end by showing you a picture I liked in AIMCo’s Annual Report (click on image):

When I speak of the importance of diversity in the workplace, this is what I’m talking about. Not to offend anyone but I’m tired of seeing old white males leading public pension funds and hiring young white males who think and act like them. I think the image above represents the real cultural diversity of Canada and I applaud AIMCo for showing many pictures like this in the Annual Report, highlighting its commitment to real diversity.

One area where I will criticize AIMCo is that they need to do a better job communicating their results to the media. Dénes Németh, Manager, Corporate Communication at AIMCo, is a good guy and he did respond promptly to my request upon returning from his vacation, but where is the press release on results and where are the articles in Canada’s major newspapers? (makes me wonder if this was deliberate because AIMCo undeprfermored its benchmark in 2014).

Still, I enjoyed reading AIMCo’s 2014 Annual Report and wish Kevin Uebelein and the rest of AIMCo’s senior officers and employees much success in navigating these tough markets over the next few years.

Lastly, I agree with Leo de Bever, these are dark days for Alberta’s energy industry. If anything, the outlook seems to grow more depressing by the week. I think Alberta is pretty much screwed for the next five to ten years and I blame the Harper Conservatives for putting all their focus on oil sands projects, neglecting Canada’s manufacturing industry in Ontario and Quebec (I know, worked at Industry Canada for a brief stint and saw massive budget cuts at the worst possible time). Canada’s leaders have learned nothing from past mistakes. That’s why I’m still short Canada even if the U.S. recovery continues for now.

[To be fair, the sorry state of manufacturing in Canada isn’t just about massive cutbacks from the federal government. Gary Lamphier of the Edmonton Journal makes a valid point when he shared this with me in an email: “I frankly put more blame on Canadian companies that were unwilling to innovate and spend money on new equipment when the loonie was at $1.10 US. Now they’re back to the same old game they played in the 1990s, hoping the low dollar will bail them out. So it’s the manufacturing sector itself that is largely to blame, not Harper’s government !! Now THAT is something you will NEVER hear in the Toronto-centric ‘national’ media — and I say that as a guy who spent 35 years of his life in Ontario, a big chunk of it reporting on the auto sector.”]


Photo credit: “Canada blank map” by Lokal_Profil image cut to remove USA by Paul Robinson – Vector map BlankMap-USA-states-Canada-provinces.svg.Modified by Lokal_Profil. Licensed under CC BY-SA 2.5 via Wikimedia Commons – http://commons.wikimedia.org/wiki/File:Canada_blank_map.svg#mediaviewer/File:Canada_blank_map.svg

Pension Pulse: The Changing Landscape of Private Equity

2611679744_5da955a118_z

Leo Kolivakis is a blogger, trader and independent senior pension and investment analyst. This post was originally published at Pension Pulse.

Devin Banerjee of Bloomberg reports, Rubenstein Says Private Equity’s Fees, Investors Have Changed:

The private equity industry has changed the most in decades as its investor base evolves and clients demand more fee concessions, Carlyle Group LP’s David Rubenstein said.

“The industry has changed more in the four or five years since the crisis than in the previous 45 years,” Rubenstein, Carlyle’s co-founder and co-chief executive officer, said Sunday on the television program “Wall Street Week.”

From the 1970s to early 2000s, public pension plans were the biggest investors in the industry, said Rubenstein, who started Washington-based Carlyle in 1987 and has expanded it to manage $193 billion. Private equity firms use the money they collect to buy companies and later sell them for a profit. Today, sovereign-wealth funds are overtaking pensions in allocating money to the firms, of which Carlyle is the second-biggest, he said.

Large investors and those who commit early to funds are also able to extract discounts on the fees they pay the buyout firms, Rubenstein said, whereas in the past all clients were charged the same percentage on their committed money.

In addition, big clients are increasingly seeking separately managed funds with the firms, rather than solely committing to commingled funds with other investors, he said.

Retirement Money

Rubenstein, 65, said the “great revolution” coming to the industry will be the ability to add non-accredited investors, or those with a net worth lower than $1 million or those earning less than $200,000 a year. Regulations of fund structures should change to allow such people to put some of their retirement savings in private equity vehicles, said Rubenstein.

“Wall Street Week” is produced by SkyBridge Media, an affiliate of SkyBridge Capital, the fund-of-funds business founded by Anthony Scaramucci. SkyBridge, which sometimes has other business relationships with the show’s participants, advertisers and sponsors, pays Fox stations in key markets to broadcast the show and also streams it online every Sunday at 11 a.m. in New York.

I’m not sure about the “great revolution” Rubenstein is talking about in terms of non-accredited retail investors being able to invest in private equity. In my opinion, retail investors are better off investing in the shares of PE giants and staying liquid, but the three biggest private equity firms posted lower second-quarter profit after U.S. stocks slipped for the first time since 2012, a harbinger of things to come.

I do however agree with Rubenstein on the changing landscape in terms of large institutions and fee compression.

In fact, large pensions and sovereign wealth funds are increasingly trying to avoid private equity fees altogether. Last week, the Wall Street Journal reported that Dutch pension-fund manager PGGM teamed up with investors including sovereign-wealth funds for the €3.7 billion ($4.06 billion) takeover of a car leasing company to help its drive to reduce the hefty fees it pays to private-equity firms:

The acquisition of LeasePlan Corporation NV from German car maker Volkswagen AG and Fleet Investments is PGGM’s largest direct private-equity transaction, according to PGGM spokesman Maurice Wilbrink.

The Dutch fund has been building its in-house team to invest in companies directly, alongside private-equity firms and other investors, after selling its private-equity investment unit in 2011. Investors from the Canada Pension Plan Investment Board to Singaporean sovereign-wealth fund GIC are increasingly seeking to buy assets directly, rather than just through private-equity firms. Several pension funds have publicly voiced their concerns over the level of fees charged by the private-equity industry.

By acquiring companies directly, PGGM avoids paying private-equity firms annual fees of between 1% and 2% of the money invested. It also avoids the 20% fee known as carry that private-equity firms keep from the sale of profitable assets.

Most of the money that PGGM manages is on behalf of PFZW, a pension fund for Dutch nurses and social workers. In 2014, PFZW paid €445 million of fees to private-equity firms—more than half of its €811 million fee bill to money managers. Yet private equity only accounts for €9 billion, or 5.6% of PFZW’s €161.2 billion of assets, according to its annual report.

“We are looking at all kinds of ways to lower management fees and also performance fees,” Mr. Wilbrink said. “We think the private-equity sector should lower its fees and should accept that more money should go to the beneficiaries because they are the capital providers and it’s their money.”

PGGM also makes its own infrastructure investments to avoid paying fees to infrastructure funds.

PGGM is buying LeasePlan in partnership with Singaporean sovereign-wealth fund GIC; the Abu Dhabi Investment Authority, or ADIA, also a sovereign-wealth fund; ATP, Denmark’s largest pension fund; the merchant-banking unit of Goldman Sachs ; and London-based private-equity firm TDR Capital LLP.

GIC, ADIA and ATP are also part of the trend among traditional investors in private-equity firms to increasingly invest directly in takeovers of companies.

The investors will pay for the acquisition with an equity investment equal to about half of the purchase price, a convertible bond of €480 million and a loan of €1.55 billion, LeasePlan said in a statement. Unlike in a traditional private-equity-backed leveraged buyout, the debt won’t be secured on the company that is being acquired.

“None of the debt raised by the Investors would be borrowed by LeasePlan and the company would not be responsible for the repayment of such debt,” LeasePlan said.

LeasePlan reported net income of €372 million in 2014, operates in 32 countries and has a workforce of more than 6,800 people.

Talk about a great deal and unlike private equity funds, large global pensions and sovereign wealth funds which invest directly in private equity have a much longer investment horizon and aren’t looking to load their acquiring companies with debt so they can profit from dividend recapitalizations.

No wonder private equity funds are worried. They know they’re cooked, which is one reason why they’re trying to emulate the Oracle of Omaha to garner ever more “long term” assets and continue to steal from clients now that times are still relatively good.

What else? Amy Or of the Wall Street Journal reports that in what may be a sign of intensifying competition for assets, several private equity firms are dipping back into old investments:

“More and more sponsors are paying up where they think they have a material informational advantage,” said Justin Abelow , a managing director of financial sponsor coverage at investment bank Houlihan Lokey Inc.

Private equity firms, armed with $1.2 trillion in uncalled capital, need to fend off peers and strategic buyers in the fierce pursuit of assets. Standard & Poor’s Capital IQ Leveraged Commentary and Data said that as of the first half of the year, the average private equity purchase price multiple crept up to 10.1 times the target company’s trailing earnings before interest, taxes, depreciation and amortization, topping a historical high of 9.7 times in 2007.

As we report in the July issue of Private Equity Analyst, some firms looking for an edge in deals are taking a trip down memory lane.

Cleveland’s Riverside Co., for example, in May bought for a second time Health & Safety Institute, a provider of training materials and cardiopulmonary resuscitation courses. It previously owned the business between 2006 and 2012.

Partner Karen Pajarillo said her firm “didn’t have as much of a learning curve as others who are new to the business,” though HSI’s mix of revenue has changed over the years to include more online learning material.

Advent International is donning yoga pants once again, acquiring nearly 14% of yoga-gear maker Lululemon Athletica Inc for $845 million last year. The New York firm invested growth capital in the Canadian apparel company in 2005 at an enterprise value of 225 million Canadian dollars, taking the company public two years later in a $327.6 million offering. Lululemon share prices have risen by about 55% since Advent’s second investment in the company.

Revisiting old investments has proved profitable in the past for some firms.

San Francisco firm Friedman Fleischer & Lowe made a 10-times return on foam-mattress company Tempur-Pedic International Inc . in 2006 when it exited the $350 million investment it made in 2002. The firm reinvested in the company in 2008, re-exiting in 2011 at a 3.3-times return.

But second time isn’t always a charm, and firms must stay mindful that times change and the formula used previously may not work again, private equity executives said. Charterhouse Capital Partners lost control of U.K. washroom services provider PHS Group after the company was taken over by lenders. Charterhouse took PHS public in 2001, before taking it private again in 2005.

The second time around is definitely not always a charm. The market is a lot more competitive now as strategics are flush with cash and overvalued shares.

Lastly, I agree with Becky Pritchard of Financial News, it’s the end of the private equity superheroes:

Quiz time. Who runs BC Partners? Who is the chairman of the British Private Equity & Venture Capital Association? And who is the top dog at Cinven?

If you drew a blank with any of those questions, you are not alone. The private equity industry, once the domain of larger-than-life characters, is full of curiously understated individuals these days.

Most of the buyout pioneers that founded Europe’s private equity industry have retired over the past decade. Men like Apax Partners’ Sir Ronald Cohen, CVC Capital Partners’ Michael Smith, Charterhouse Capital Partners’ Gordon Bonnyman, Permira’s Damon Buffini and Terra Firma’s Guy Hands got outsized returns for their investors and often had outsized personalities – charismatic, bombastic or just plain mouthy.

But, for the most part, they have stepped back to be replaced by committees and a generation of top executives with a lower profile. This new generation are more bureaucrats than entrepreneurs.

Industry roots

Thomas Kubr, managing director of investor Capital Dynamics, said he “absolutely” thought that Europe’s private equity leaders had changed in style over the past decade. Part of that was down to the early roots of private equity, he said: “The industry was started by people who never in their life thought they would be doing private equity because they had no clue what that was. Now you have entire career paths structured around the industry.”

Many of Europe’s biggest private equity firms began life in the banks. They were staffed by smart people that the banks were not sure what to do with, according to Ian Simpson, founder of placement agent Amala Partners, who has worked in the industry for 27 years.

The first industry leaders were the ones deemed by the banks to be “too dangerous to lend money but too bright to stick in HR”, he said.

Those years were a heady time for private equity: it was still almost a cottage industry and deal-doers were able to score blockbuster returns. Guy Hands made around £3 billion profit working for Nomura in the 1990s, for instance. Under Bonnyman’s leadership, Charterhouse invested €73 million in UK government leasing company Porterbrook in 1996, eventually getting a $481 million profit when it flipped it a year later.

In 1996, under Cohen’s leadership, Apax built up a 33% stake in Cambridge-based software company Autonomy, later selling its holding during the technology bubble of 2001 for a capital gain of more than £1 billion.

After pioneering the techniques used on buyouts at the banks, many of these trail-blazers decided to spin out and start their own firms. Buffini led the management buyout of Permira from Schroders Ventures Europe in 2001, Bonnyman led the spin out of Charterhouse Capital Partners from HSBC in 2001 and Hands left Nomura’s principal finance arm to set up Terra Firma in 2001.

New leadership style

Over the early 2000s, those new firms grew rapidly from small operations into huge asset managers with money pouring in from investors. Returns also began to slide as more players entered the market and the business became more institutionalised.

In the years around the financial crisis, many of the founders handed the reins over to the next generation of leaders or even groups of leaders, many of whom had lower public profiles than their predecessors. Cohen stepped back from running Apax in 2004, handing over to Martin Halusa; Buffini handed control of the firm to Kurt Björklund and Tom Lister in 2007; and Smith retired as chairman of CVC in 2012, handing control to Rolly van Rappard, Donald Mackenzie and Steve Koltes.

Antoon Schneider, a senior partner at The Boston Consulting Group, said the new generation were more managers than entrepreneurs but that a different financial environment called for a fresh style of leadership.

He said: “The great deal guys became the founding partners of the industry. The best dealmakers got to the top but now, with the second generation, it’s less about that. They are less entrepreneurs than they are managers. These are now larger, more complex organisations and the fact that you aren’t necessarily in a high-growth environment, you could argue that calls for a different kind of leader.”

A focus on the institution rather than on the individual is now reflected in the agreements made between investors and the buyout firms, known as limited partner agreements. These documents traditionally named one or two “key men” – if these named individuals left or died, investors could put investment from the fund on hold. These days there are usually a large group of key men mentioned in fund documents, reflecting how much more institutionalised and less focused on individuals the asset class has become.

Is the industry missing out on the entrepreneurialism of the early mavericks? Simpson said investors now want consistency from their managers rather than the bursts of genius that became the mark of the old guard.

He said: “They were a bit more entrepreneurial. The people in private equity come from a much more consistent background now. Everyone is a lot more interested in process and repeatability. Investors push that way.”

Jim Strang, a managing director at Hamilton Lane, thinks this change in leadership style has been a positive step for investors and has made the industry more professional. He said: “As PE firms have evolved, they have become large, complex businesses in their own right. The tools that you need to be a great business manager are different to being a great deals professional. So the fact that you have a different look and feel is probably a good thing.”

Minimising risks

He added that the new generation of leaders were more focused on how to run their firms and grow their businesses than their traditional deal-doing forefathers. He said: “The industry is way more competitive, way more sophisticated and developed than it was back in the day. They have got much better thinking about how to institutionalise their business to make it less risky.”

Perhaps the change was inevitable. As the industry has matured, it is natural for the focus to shift from the individual to the institution. But it does mean that many of the largest firms have become faceless behemoths that are tricky to tell apart.

Kubr summed it up: “You’ll find it in any industry. You get the true pioneers who develop a lot of the structures – but what comes afterwards is that you have to get professionalised. I guess I would say it’s neutral. It’s just a different style.”

The institutionalization of private equity, hedge funds, real estate, infrastructure is changing the landscape for the large alternative shops and placing ever more pressure on funds to tighten compliance and align their interests with investors.

Moreover, markets are changing faster than ever and private equity firms that fail to adapt to this new environment are going to be left behind. What I see happening in the future is a bifurcation in the private equity industry where the giants get bigger by collecting more assets from large pensions and sovereign wealth funds but their returns start sagging as competition heats up in the large cap space and deflation takes hold.

The smaller private equity firms which are typically more focused on performance will continue doing well by focusing on smaller deals and they will collect their assets from family offices and small endowment and pension funds. Also, the CalPERS of this world will continue to focus some of their capital in emerging manager programs to transition them to their mature manager portfolio (watch the latest CalPERS’ board meeting at the end of my last comment).

Hope you enjoyed reading this comment. As always, please remember to click on my ads and more importantly to donate or subscribe to this blog via PayPal at the top right-hand side.

I am off to my appointment at the Montreal Neurological Institute where I am taking part in an Opexa study for progressive Multiple Sclerosis using my own T-cells (hard to know whether you’re on the placebo). Whether you have or haven’t contributed to my blog, please donate to the MNI as it’s truly an incredible hospital and research center, conducting clinical and basic research and providing extraordinary care to thousands of patients with neurological diseases.


Photo  jjMustang_79 via Flickr CC License

Pension Pulse: California Dreamin’?

640px-Flag_of_California.svg
Leo Kolivakis is a blogger, trader and independent senior pension and investment analyst. This post was originally published at Pension Pulse.
Dan Walters of the Sacramento Bee reports, California pension funds saw $100 billion gain in 2013-14:

California’s state and local government pension systems saw their assets climb by more than $100 billion during the 2013-14 fiscal year, outpacing the national trend by several percentage points, according to a new Census Bureau report.

Although payouts from the systems to retirees rose by $3 billion, additional contributions from government employers and their employees and a sharp increase in investment earnings contributed to the asset gain.

By the close of the fiscal year, California fund assets had risen to $751.8 billion, a gain of 15.5 percent from the previous year, the Census Bureau reported. Nationwide, state and local pension funds saw a 12.8 percent increase.

The major reason for the gain was a 46.3 percent increase in earnings to $115.8 billion. Another $30.1 billion in contributions – 70 percent of it from employers – added to the total revenue stream, offset by $46.1 billion in payouts to 1.2 million retirees.

State pension funds, led by the California Public Employees Retirement System, held 72.4 percent of total assets, with the remainder scattered among local pension systems.

But the state funds’ $544.8 billion in assets fell short of their reported $661.2 billion in calculated pension obligations, with the gap constituting an “unfunded liability.”

Overall, the state’s funds had 82 percent of what they needed to cover obligations, up from 77 percent the previous year. CalPERS has pegged its level most recently at 77 percent. The Census Bureau report did not delve into local pension funds’ unfunded liabilities.

Generally, pension fund analysts believe that they need to have at least 80 percent of liabilities covered by current assets to be considered healthy.

Despite the 2013-14 earnings increase, it’s likely that the next annual report will show more modest pension fund gains. CalPERS recently reported that its 2014-15 earnings were just 2.4 percent, less than a third of its 7.5 percent assumption, and other pension funds have reported less-than-stellar investment gains as well.

Indeed, choppy markets weren’t good for CalPERS in fiscal 2014-2015. Dale Kasler of the Sacramento Bee recently reported, CalPERS reports 2.4 percent investment gain:

CalPERS reported a 2.4 percent profit Monday on its investments for the just-ended fiscal year, its lowest return in three years.

The performance is significantly below the pension fund’s official investment forecast of 7.5 percent, and could lead to another round of rate hikes for the state and the hundreds of local governments and school districts that belong to the California Public Employees’ Retirement System.

CalPERS officials, though, said a decision on rate increases is a ways off. They added that despite the low results for fiscal 2014-15, they’ve earned an average return of nearly 11 percent over the past five years and the pension fund isn’t in any immediate trouble because of one difficult year.

“We are a long-term investor,” said Ted Eliopoulos, the fund’s chief investment officer, in a conference call with reporters.

Choppy returns in the stock market held back the performance of CalPERS’ portfolio. CalPERS gained just 1 percent on its stocks, which make up 54 percent of the total portfolio of $300.1 billion.

Eliopoulos said the sparse returns on CalPERS’ stock portfolio were not a surprise in light of a strong run-up in prices the past several years. “We’re going on six years on a bull run in equity markets in the United States,” he said. “The prospects for returns are moderating.”

CalPERS’ investment performance has an enormous impact on the contribution rates charged to the state and local governments and school districts. CalPERS has been hiking those contributions by hundreds of millions of dollars annually in recent years to compensate for huge investment losses in 2008 and 2009, and to reflect larger government payrolls and predictions of longer life spans for current and future retirees.

Read more here: http://www.sacbee.com/news/business/article27123799.html#storylink=cpy

Eliopoulos wouldn’t say if the latest investment results would bring more rate increases. “We have a whole other (rate-setting) process that will now take into account these returns,” he said. That process “will take some time.”

The 2.4 percent gain for the year that ended June 30 pales in comparison to the 18 percent profit earned a year earlier. While the stock holdings eked out minimal gains, the real estate portfolio earned a 13.5 percent return and private-equity investments earned 8.9 percent.

Read more here: http://www.sacbee.com/news/business/article27123799.html#storylink=cpy

The pension fund was 77 percent funded as of a year ago, the latest data available. While CalPERS has plenty of money to pay retirees for now and the foreseeable future, the funding ratio means it has 77 cents in assets for every $1 in long-term obligations. Some experts say 80 percent is an adequate funding level, while others say pension systems should be 100 percent funded.

I’ve said it before and I’ll say it again, CalPERS’ investment results are all about beta. As long as U.S. and global stock markets surge higher, they’re fine, but if a long bear market develops, their beneficiaries and contributors are pretty much screwed.

The same goes on all over the United States which why the trillion dollar state funding gap keeps getting bigger and risks toppling many state plans over if another financial crisis hits global markets.

Now, CalPERS has done some smart moves, like nuke its hedge fund program which it never really took seriously to begin with, paying outrageous fees for leveraged beta. In private equity, it recently announced that it’s consolidating its external managers to reduce fees and have more control over investments.

But the giant California public pension fund isn’t without its critics. Even I questioned whether failure to disclose all private equity fees isn’t a serious breach of their fiduciary duty. And by the way, that fellow sitting there at the top of this comment is Joseph John Jelincic Jr. who according to the first article I cited above, is an investment officer at CalPERS Global Real Estate and also member of CalPERS’ Board of Directors.

When I read that under his picture, I almost fell out of my chair. Talk about a serious conflict of interest. To be fair, Jelincic asks tough questions but it’s simply unacceptable to have someone who works as at a public pension fund, especially in investments, to sit on its board. That’s a total governance faux pas!

[Update: Chris Tobe of Stable Value Consultants clarified this situation in a subsequent email:”JJ. Jelincic in my opinion is by far the most effective trustee on a US public pension plan ever. He was elected by State employees. My understanding is that he is on indefinite leave from his staff position at CALPERS, (but receives his full pay) to actually be a full time employee. The conflict issues were dealt with years ago.]

Apart from the lack of independent, qualified board of directors, another governance problem at CalPERS and other U.S. state pension funds is the compensation is too low to attract qualified pension fund managers who can bring assets internally and add value at a fraction of the cost of going external. Sure, some big U.S. pensions are now opening their wallet to attract talent, but I remain very skeptical as the governance is all wrong (too much political interference).

I ran a search on CalPERS’ website to view their latest comprehensive annual report and couldn’t find it. The 2014 Annual Report is available for investment results as of June 30th, 2014 (fiscal year) but the latest one isn’t available yet. I did however find a news release, CalPERS Reports Preliminary 2014-15 Fiscal Year Investment Returns:

The California Public Employees’ Retirement System (CalPERS) today reported a preliminary 2.4 percent net return on investments for the 12-months that ended June 30, 2015. CalPERS assets at the end of the fiscal year stood at more than $301 billion.

Over the past three and five years, the Fund has earned returns of 10.9 and 10.7 percent, respectively. Both longer term performance figures exceed the Fund’s assumed investment return of 7.5 percent, and are more appropriate indicators of the overall health of the investment portfolio. Importantly, the three- and five-year returns exceeded policy benchmarks by 59 and 34 basis points, respectively. A basis point is one one-hundredth of a percentage point.

“It’s important to remember that CalPERS is a long-term investor, and our focus is the success and sustainability of our system over multiple generations,” said Henry Jones, Chair of CalPERS Investment Committee.

It marks the first time since 2007 that the CalPERS portfolio has performed better than the benchmarks for the three- and five-year time periods, and is an important milestone for the System and its Investment Office. CalPERS 20-year investment return stands at 7.76 percent.

“Despite the impact of slow global economic growth and increased short-term market volatility on our fiscal year return, the strength of our long-term numbers gives us confidence that our strategic plan is working,” said Ted Eliopoulos, CalPERS Chief Investment Officer. “CalPERS continues to focus on our mission of managing the CalPERS investment portfolio in a cost-effective, transparent and risk-aware manner in order to generate returns to pay long-term benefits.”

The modest gain for the fiscal year – despite challenging world markets and economies – was helped by the strong performance of CalPERS real estate investments, approximately ten percent of the fund as of June 30, 2015. Investments in income-generating properties like office, industrial and retail assets returned approximately 13.5 percent, outperforming the Pension Fund’s real estate benchmark by more than 114 basis points.

Overall fund returns and risks continue to be driven primarily by the large allocation to global equity, approximately 54 percent of the fund as of June 30, 2015. The Global Equity portfolio returned one percent against its benchmark returns of 1.3 percent. Key factors over the past twelve months include the strengthening of the US dollar versus most foreign currencies, as well as challenging emerging market local returns. Fixed Income is the second largest asset class in the fund, approximately 18 percent as of June 30, 2015, and returned 1.3 percent, outperforming its benchmark returns by 93 basis points.

Private Equity, approximately nine percent of the fund as of June 30, 2015, recorded strong absolute returns for the fiscal year, earning 8.9 percent, while underperforming its benchmark by 221 basis points (click on image).

Returns for real estate, private equity and some components of the inflation assets reflect market values through March 31, 2015.

CalPERS 2014-15 Fiscal Year investment performance will be calculated based on audited figures and will be reflected in contribution levels for the State of California and school districts in Fiscal Year 2016-17, and for contracting cities, counties and special districts in Fiscal Year 2017-18.

Now, a few points here. First, like so many other delusional U.S. public pension funds, CalPERS is wrong to cling to its 7.5% discount rate based on the pension rate-of-return fantasy. That works fine as long as stocks are in a bull market, but with rates at historic lows, when stocks turn south, those rosy investment projections will come back to haunt them.

Second, even though their fiscal years are off by a quarter, CalPERS seriously underperformed CPPIB, bcIMC, and PSP Investments in fiscal 2015. Admittedly, this isn’t a fair comparison as one bad quarter in stocks can hurt overall performance and one is a large U.S. pension fund whereas the others are Canadian, but still over a one, five and ten year period, Canada’s large pensions are significantly outperforming their U.S. counterparts, especially on a risk-adjusted basis.

Third, the investment results for CalPERS’ Real Estate and Private equity are as of the end of March, so we can make some comparisons there with the results of these asset classes in fiscal 2015. I have PSP’s fiscal 2015 results fresh in mind, so here are some quick observations:

  • In CalPERS’ Private Equity returned 8.9% in fiscal 2015, underperforming its benchmark by 221 basis points. PSP’s Private Equity gained 9.4% in fiscal 2015 versus its benchmark return of 11.6%, an underperformance of 220 basis points. In other words, in private equity, both programs performed similarly except that PSP’s Private Equity program invests a lot more directly than CalPERS’ and pays out significantly fewer fees to external PE managers (they do invest in funds for co-investment opportunities).
  • In Real Estate, CalPERS returned 13.5% in fiscal 2015, outperforming its real estate benchmark by 114 basis points. PSP’s Real Estate significantly outperformed its benchmark by 790 basis points (12.8% vs 4.9%) in fiscal 2015. Again PSP invests directly in real estate, paying fewer fees than CalPERS, but clearly the benchmark PSP uses to gauge the performance of its real estate portfolio does not reflect the risks and beta of the underlying investments.
  • The same can be said about PSP’s Natural Resources which far surpassed its benchmark return(12.2% vs 3.6%) while CalPERS’ Forestland significantly underperformed its benchmark in fiscal 2015 by a whopping 1094 basis points (not exactly the same as forestland is a part of natural resources but you catch my drift). I think this is why CalPERS is divesting from these investments.
  • Only in Infrastructure did CalPERS significantly outperform its benchmark by 932 basis points, gaining 13.2% in fiscal 2015. By comparison, PSP’s Infrastructure gained 10.4% vs 6.1% for its benchmark, an outperformance of 430 basis points. Again, I don’t have issues with PSP’s Infrastructure benchmark, only their Real Estate and Natural Resources ones, and just like CPPIB, the Caisse and other large Canadian pensions, PSP invests directly in infrastructure, not through funds, avoiding paying fees to external managers.
  • It goes without saying that no investment officer at CalPERS is getting compensated anywhere near the amount of PSP’s senior managers or other senior managers at Canada’s large public pension funds (Canadian fund managers enjoy much higher compensation because of a better governance model but some think this compensation is extreme).

I better stop there as I can ramble on and on about comparing pension funds and the benchmarks they use to gauge the performance of their public and private investments.

I’m still waiting to hear about that other large California public pension fund, CalSTRS, but their annual report for fiscal 2015 isn’t available yet. I don’t expect the results to be significantly different from those of CalPERS and it too is embroiled in its own private equity carry fee reporting scandal.

Below, I embedded the latest CalPERS’ investment committee board meeting on June 15th, 2015.

For a pension and investment junkie like me, I love listening to these board meetings. I think you should all take the time to listen to this meeting, it’s boring at parts but there are some great segments here and I applaud CalPERS for making these board meetings public (good governance).

Analysis: PSP Investments Gains 14.5% in Fiscal 2015

496px-Canada_blank_map.svgLeo Kolivakis is a blogger, trader and independent senior pension and investment analyst. This post was originally published at Pension Pulse.
The Canada News Wire reports, PSP Investments Reports Fiscal Year 2015 Results:

The Public Sector Pension Investment Board (PSP Investments) announced today a gross total portfolio return of 14.5% for the fiscal year ended March 31, 2015 (fiscal year 2015). For the 10-year period ended March 31, 2015, PSP Investments’ net annualized investment return reached 7.6% or 5.8% after inflation, significantly above the net long-term rate of return objective used by the Chief Actuary of Canada for the public sector pension plans, which averaged 6.0% or 4.2% after inflation for the period.

The investment return for the year exceeded the Policy Portfolio Benchmark rate of return of 13.1%, representing $1.5 billion of value added. In Fiscal 2015, all portfolios achieved solid performances, the majority generating double digit investment returns.

“We are pleased with these strong returns in a year that saw the appointment of a new Chair in November 2014 and the arrival of André Bourbonnais, our new President and CEO, at the end of March 2015,” said Michael P. Mueller, Chair of the Board of PSP Investments. “This performance attests to the strength and depth of the organization and its senior management team and to the quality of its corporate governance.”

“I wish to highlight the contribution of two of our key people whose efforts were crucial to keeping us on course to record these strong results; namely, John Valentini, who led us with great poise during his tenure as Interim President and CEO, and Cheryl Barker, who stepped up solidly in her role as Interim Chair during a large part of the year,” added Mr. Mueller.

Solid Foundation from which to Grow

“I wholeheartedly embrace PSP Investments’ important social mission of contributing to the long-term sustainability of the public sector pension plans for the ultimate benefit of the contributors and beneficiaries,” said André Bourbonnais, President and CEO of PSP Investments. “I intend to build on the strength and depth of our organization to deliver on that mission. With the projected growth in assets -, this will undoubtedly involve expanding into still more asset classes, transforming PSP Investments into a truly global pension investment manager with a local presence in select international markets and supplementing the organizational structure to better capture opportunities at the total fund level.”

Surpassing Targets and Financial Thresholds

In fiscal 2015, PSP Investments’ net assets increased by $18.3 billion or 20%. These gains were attributable to a combination of strong investment performance and net contributions. Net assets at the end of fiscal 2015 exceeded the $100-billion threshold to a record $112.0 billion. PSP Investments generated profit and other comprehensive income of $13.7 billion in the latest fiscal year. Over the past five-year period, PSP Investments recorded a gross compound annualized investment return of 11.7% and generated $43.3 billion in investment income.

Public Markets Equities, Fixed Income and Private Markets Post Solid Returns

For fiscal 2015, Public Markets Equities returns ranged from 7.2% for the Canadian Equity portfolio to 29.5% for the US Large Cap Equity portfolio. The Fixed Income portfolio generated a return of 9.4% while the return for the World Inflation-Linked Bonds portfolio was 16.9%.

In 2015, all Private Markets asset classes achieved strong investment returns. Real Estate and Natural Resources1 led the way with returns of 12.8% and 12.2%, respectively. Infrastructure posted a 10.4% investment return while the Private Equity portfolio investment return was 9.4%.

The asset mix as at March 31, 2015, was as follows: Public Markets Equities 50.2%, Fixed Income and World Inflation-Linked Bonds 17.9%, Real Estate 12.8%, Private Equity 9.0%; Infrastructure 6.3%; Cash and Cash Equivalents 2.4% and Natural Resources 1.4%.

As Scott Deveau of Bloomberg reports, PSP Builds Credit Office in New York in Global Expansion:

Public Sector Pension Investment Board will open offices in New York and London and is eyeing Asia as part of the Canadian fund’s plan to double its C$112 billion ($86 billion) in assets over the next decade.

PSP plans to build a loan-origination business in New York and private-equity operations in London this year, Andre Bourbonnais, chief executive officer of PSP, said in a phone interview Thursday.

“We’re going to stick to the markets we know better, which is essentially the Western world,” he said. Within 24 months PSP will look at getting an office in Asia, he said. “Having a foot on the ground there is going to be key for local knowledge, local human capital and being closer to our partners.”

PSP, which oversees the retirement savings of federal public servants, including the Royal Canadian Mounted Police, follows other domestic pension funds bulking up operations overseas.

The U.S. and Europe are presenting the greatest opportunity for investment in challenging markets where many investors are chasing deals, he said.

The fund returned 15 percent on its investments in the year ended March 31, 2015, and increased the value of its assets under management by 20 percent over the year, according to a statement Thursday.

Break Silos

Bourbonnais took over as chief executive of PSP in March after serving as global head of private investment at Canada Pension Plan Investment Board. He said he has already implemented measures within the organization aimed at breaking down barriers between the pension plan’s various departments so it can compete more effectively.

“This place has been built pretty much bottom up, with each investment class doing their own thing,” he said. “We need to break the silos and try to get as much synergies from the group as possible.”

PSP has also created a new chief investment officer position, and has reorganized its debt and credit functions under one roof and its private investment arms under another, he said.

Mr. Bourbonnais is right, PSP was mostly built from the bottom up and his predecessor, Gordon Fyfe, didn’t have the foresight to hire a chief investment officer, preferring instead to wear both hats of CEO and CIO (which he is now doing at bcIMC).

To be fair, Gordon did create an Office of the CIO and had the brains to hire my former colleague Mihail Garchev and a few other analysts, but it was woefully under-staffed and desperately needed new direction and more “synergies” between public and private markets.

The person now responsible for leading this group is Daniel Garant who came to PSP back in 2008 from Hydro-Québec where he was their CFO to head PSP’s Public Markets. According to PSP’s website, Mr. Garant was just appointed CIO this July.

Apart from appointing Mr. Garant CIO, Mr. Boubonnais also recently promoted Anik Lanthier to the position of  Senior Vice President, Public Equities and Absolute Return. She is now part of senior management at PSP.

Also worth noting that Derek Murphy, the former head of Private Equity, is no longer with PSP. He left the organization soon after Mr. Bourbonnais got to PSP in early April after being appointed in late January. Neil Cunningham, the Senior Vice President and Global Head of Real Estate Investments is now acting as the Interim Senior Vice President, Global Head of Private Investments.

Now that we got those HR issues out of the way, it’s time to go over PSP’s fiscal 2015 results. I urge you all to take the time to read PSP’s 2015 Annual Report. It is extremely well written and provides a lot of useful information on investments and other activities at PSP during fiscal 2015.

Let’s begin by looking at PSP’s portfolio and benchmark returns which are available on page 21 of the Annual Report (click on image):


As you can see, there were strong returns across Public and Private Markets in fiscal 2015. Returns of global public equities were particularly strong, especially in the U.S. (+29.5%) where the boost from the USD also helped bolster the Public Equity portfolio (PSP indexes its large cap U.S. equity exposure).

In terms of Public Markets, it’s worth reading the passage below taken from page 22 of the Annual Report (click on image):


The key points to remember on Public Markets are the following:

    • U.S. Large Cap Equity, which is indexed, delivered solid gains (+29.5%) and were boosted by the surging U.S. dollar.
  • Emerging Markets Equity, which are also indexed, delivered solid gains of 15.2% in FY 2015.
  • EFEA Large Cap Equity which isn’t indexed and managed internally, underperformed its benchmark by 80 basis points in fiscal 2015 (12.9% vs 13.7%).  Over a five-year period, however, this portfolio is on par with its benchmark (11.1% vs 11%).
  • Canadian Equity portfolio slightly outperformed its benchmark by 30 basis points (7.2% vs 6.9%) as did the Small Cap Equity portfolio, gaining 20 basis points over its benchmark (25% vs 24.8%).
  • Fixed Income underperformed its benchmark by 70 basis points in fiscal 2015 (11.7% vs 12.4%) as strong gains in World Inflation-Linked Bonds (+16.9%), which are indexed, were offset by weak performance elsewhere. On page 23 of the Annual Report, it states that the “underperformance can be explained by the positioning of the Fixed Income portfolio to take advantage of rising US and global rates” (good luck with that call, especially if global deflation hits the world economy).
  • There was a good balance between internal and external absolute return mandates, with the former adding $115 million of relative value and the latter adding $193 million of relative value. Good positioning on the USD vs the euro, geographic and sector calls (like underweighting energy) and fixed income relative value trading all added to absolute returns in fiscal 2015.
  • The internal Value Opportunity portfolio gained 30.1% in fiscal 2015, contributing $35 million in relative value. The positive added value was partially offset by the underperformance of PSP’s Active Fixed Income portfolio.
  • Asset-backed term notes contributed $29 million in relative value, as PSP continued to benefit from a reduction of risk on the underlying assets as they approach maturity.

In terms of Private Markets, here are some of my observations:

  • Real Estate, where the bulk of the private assets are concentrated, significantly outperformed its benchmark by 790 basis points (12.8% vs 4.9%) in fiscal 2015. Net assets of the Real Estate portfolio totalled $14.4 billion at the end of fiscal year 2015, an increase of $3.8 billion from the prior fiscal year.
  • Over the last five fiscal years, Real Estate has gained 12.6%, far outpacing its benchmark return of 5.7%. These gains relative to the RE benchmark accounted for the bulk of the value added at PSP over this period.
  • There were also strong gains in Infrastructure (10.4% vs 6.1%) and Natural Resources (12.2% vs 3.6%) relative to their respective benchmarks.
  • The only private market asset class that underperformed its benchmark was Private Equity, gaining 9.4% in fiscal 2015 versus its benchmark return of 11.6%. Still, over the last five fiscal years, Private Equity has managed to gain 220 basis points above its benchmark (15.4% vs 13.2%).

Once again, there were spectacular gains in private markets — especially in Real Estate, Infrastructure and Natural Resources — relative to their respective benchmarks.

So what are the benchmarks of the portfolios? Below, I provide you with the benchmarks of each portfolio taken from page 20 of the Annual Report (click on image):


I will tell you right away the benchmarks for Real Estate, Natural Resources and to a much lesser extent Infrastructure (respective cost of capital), do not reflect the risks of the underlying portfolio, especially in Real Estate. At least Private Equity cleaned up its benchmark to now include Private Equity Fund Universe plus its cost of capital. 

The benchmark for PSP’s Real Estate portfolio is particularly egregious given that it’s gotten easier to beat since my time at PSP and since I wrote my second blog comment back in June 2008 on alternative investments and bogus benchmarks.

Read the passages below taken from page 24 and 25 of the Annual Report (click on image):


No doubt, there were strong gains in core markets like the United States, but PSP is taking quite a bit of real estate risk in emerging markets and it’s also taking a lot of opportunistic real estate risk. Even risks in developed markets like New Zealand and Australia can whack PSP as their currencies are plunging in the latest rout in commodities.

This just proves my point that the Auditor General of Canada really dropped the ball in its Special Examination of PSP Investments back in 2011. It’s abundantly clear to me that the Office of the Auditor General lacks the resources to perform an in-depth performance, risk and operational due diligence on PSP or any other large Canadian public pension fund (that is a huge and increasingly worrisome governance gap that remains unaddressed).

As I’ve stated plenty of times on my blog, when it comes to gauging performance, it’s all about benchmarks, stupid! You can can have a monkey taking all sorts of opportunistic real estate risk, handily beating his or her bogus “cost of capital” benchmark over any given year, especially over a four or five year period.

And let me be clear here, I’m not taking personal swipes at Neil Cunningham, the head of PSP’s real estate portfolio. Neil is a hell of real estate manager and a good person. Unlike his predecessor, which I didn’t particularly like, I actually like him on a professional and personal basis (he taught me how to implement my Yahoo stock portfolio and always had time to chat real estate with me).

But when I see the shenanigans that are still going on at PSP in terms of some of their private market benchmarks, I’m dumfounded and wonder why the Board of Directors are still letting this farce go on. 

And why are benchmarks important? Because they determine compensation at PSP and other large Canadian public pension funds. Period. If the Board doesn’t get the benchmarks in all portfolios right, it allows pension fund managers to game their respective benchmark and handily beat it, making off like bandits.

Have a look at the compensation of PSP’s senior managers during fiscal 2015 taken from page 69 of the Annual Report (click on image):


As you can see, the senior managers at PSP are compensated extremely well, far better than their counterparts at the Caisse and many other large Canadian public pension funds. 

No doubt, compensation is based on four-year rolling returns and PSP has delivered on this front, adding significant value but you have to wonder if they got the Real Estate and other private market benchmarks right from the get-go, would it have impacted the added-value and compensation of PSP’s senior managers? (the answer is most definitely yes).

By the way, you will also notice Mr. Bourbonnais made roughly $3 million in total compensation in fiscal 2015, which was a signing bonus, and in a footnote it says he was given a guarantee that his total direct compensation over the next three fiscal years will be no less than $2.5 million a year.

It’s important however to keep in mind that Mr. Bourbonnais walked away from a big position at CPPIB where he was head of private markets and pretty much had that amount guaranteed in terms of total compensation over the next three fiscal years, so even though this seems outrageous, it’s not. It’s only fair given what he walked away from.

Also, John Valentini deserved his total compensation in fiscal 2015 given he was the interim president for a long time before André Bourbonnais got there. Daniel Garant’s total compensation will rise significantly over the next three fiscal years too given the increased responsibility he has (although I’m not sure if he is CIO of Public and Private Markets like Neil Petroff was or CIO of Public Markets like Roland Lescure at the Caisse).

In any case, PSP’s fiscal 2015 results were excellent and there’s no question that apart from criticism of some of their private market benchmarks, they’re doing a great job managing assets on behalf of their contributors and beneficiaries. 

I would just add that PSP needs to do a lot more work in terms of diversifying its workplace at all levels of the organization, and do a lot more to hire minorities, especially persons with disabilities (that is another HR audit that should take place at every single large Canadian public pension fund, not just PSP).

Finally, while Canada’s pension plutocrats enjoy millions in total compensation, I kindly remind them and others that I work very hard trading and blogging to get by and the least they should do is show their support for the tremendous work I do in providing them and others with the latest insights on pensions and investments. Remember, it takes a special guy to battle progressive MS and do what I’m doing.

Once again, please take the time to carefully read PSP’s 2015 Annual Report, it’s excellent and covers a lot of topics that I forgot to cover or don’t have time to cover. For example, over 73% of PSP’s assets are now managed internally and the cost of managing these assets is significantly lower than any mutual fund.

Back in May, André Bourbonnais, president and chief executive officer of the Public Sector Pension Investment Board, Winston Wenyan Ma, managing director and head of the North America Office at China Investment Corporation, Ron Mock, president and chief executive officer of Ontario Teachers Pension Plan, and Michael Sabia, president and chief executive officer of Caisse de dépôt et placement du Québec, participated in a panel discussion about Canadian pension plans and investment strategy. Bloomberg’s Scott Deveau moderated the panel at the Bloomberg Canada Economic Series in Toronto (May 21, 2015). Please take the time to listen to this discussion here.


Photo credit: “Canada blank map” by Lokal_Profil image cut to remove USA by Paul Robinson – Vector map BlankMap-USA-states-Canada-provinces.svg.Modified by Lokal_Profil. Licensed under CC BY-SA 2.5 via Wikimedia Commons – http://commons.wikimedia.org/wiki/File:Canada_blank_map.svg#mediaviewer/File:Canada_blank_map.svg

Ontario’s Pension Power Grab?

496px-Canada_blank_map.svgLeo Kolivakis is a blogger, trader and independent senior pension and investment analyst. This post was originally published at Pension Pulse.

The National Post published its editorial comment on Ontario’s pension power grab:

A new Fraser Institute report raises serious questions about the veracity of the Ontario government’s claim that a new provincial pension plan, intended as a supplement or alternative to restructuring and expanding the Canada Pension Plan, is needed because of a savings shortfall among retiring Ontarians.

The justification for the new pension plan, outlined in the Ontario Retirement Pension Plan Act — which was passed in the spring and is set to be implemented in 2017 — is that, “a significant portion of today’s workers are not saving enough to maintain their standard of living when they retire.”

As we have previously argued on this subject, however, the claim that retirees are not sufficiently funded — both with savings and existing pension benefits — is dubious. Indeed, a wealth of evidence suggests that a majority of Ontarians are saving enough through private and public investment vehicles to maintain their standard of living through retirement. On this ground alone, we should be skeptical of the Wynne government’s proposal.

But the Fraser report goes further in demonstrating that the fruit of more government-mandated savings schemes — which is what the Ontario Pension Plan will effectively be — would likely be offset in private savings. At least this is what happened before, according to the study, when mandatory increases to Canada Pension Plan (CPP) contributions came into effect in the late 1990s.

With each new percentage point of earnings mandated for contribution, the report finds, there was a “substitution effect,” namely a 0.895 per cent drop in voluntary savings. In other words, an additional dollar contributed to the CPP led to a proportionate decrease in the average household’s private savings. If such findings prove consistent with the implementation of this provincial plan, then the entire exercise will be a waste, leading to greater government control over retirement savings than is currently the case.

As co-author Charles Lammam told the Financial Post, “If (Canadians’) income and (lifestyle) preference(s) do not change, and the government mandates additional savings through government pension plans, Canadians will simply reshuffle their retirement savings, with more money going to forced savings and less to voluntary savings.”

The report also rightly points out that government-mandated savings offer less flexibility than private savings vehicles such as RRSPs, which allow Canadians to withdraw money to pay for a home or their education. Of course, reduced private savings mean not only fewer options for what one can do with those savings, but also greater dependence on government to doll out one’s retirement income.

Perhaps the worst part of this story is the way Ontario’s new pension plan is being sold as a kind of gift from the government, rather than a further burden to be borne by workers for the sake of questionable outcomes. The government will be taking your money for safe keeping, thus forcing you to save on its terms.

Moreover, maximizing the return to pensioners is not the only goal here: it is also going to provide “new pools of capital” for government projects; in other words, a tax hike under the guise of a retirement savings plan. And by diverting money from private investments, it will reduce the amount of capital available to the business world — the economic engine of our country that, unlike government, actually creates wealth and encourages job growth.

It would be far better to encourage private savings, thus giving individuals and households more control over their financial planning, rather than making them more beholden to the unreliable investment prerogatives of the government of Ontario. That would be a retirement savings plan worth supporting.

Unfortunately, I wouldn’t expect anything less from the Fraser Institute and National Post than the pathetic drivel being put out on the Ontario Retirement Pension Plan.

Let me briefly share with you my thoughts on this new report. First, I don’t dispute the claim of the authors that increasing CPP contributions or ORPP contributions will lead to less private savings but the reality is that far too many Canadians dreaming of retirement are not actually saving for it.

Second, and most importantly, so what if there is less private savings? Banks, insurance companies and mutual fund companies will all cry foul but the reality is they’re all more or less charging Canadians outrageous fees, peddling the same mediocre funds which drastically underperform public markets over a long period (I’m talking about the bulk of funds here).

Third, and related to the second point, the authors of this report conveniently ignore the brutal truth on defined-contribution plans. The truth is defined-contribution (DC) plans are vastly inferior to defined-benefit (DB) plans for many reasons, chief among them is they’re expensive and largely rise and fall with the vagaries of public markets. In other words, there are no guarantees with DC plans, if a bear market develops when you’re getting ready to retire, you’re pretty much screwed.

Fourth, the authors ignore the numerous advantages of a well-governed DB plan:

In a nutshell, here are the main benefits of DB pensions worth highlighting:

  • Provide predictable retirement benefits not subject to vagaries of public markets
  • Pool longevity risk and investment risk
  • Lower costs significantly by bringing assets internally, avoiding fees charged by many closet indexers and external managers
  • Invest in public and private markets directly or externally with some of the best global money managers. Private equity is trying to tap the DC pension space but this won’t change the fact that DB pensions have an advantage because they invest directly into private markets and funds, and co-invest with GPs on large transactions.
  • The alignment of interests is much better in DB pensions than DC pensions

Finally, there is one big myth that really irks me which I want to lay to rest. The assets of Canada’s top ten and most other DB pensions are a product of investment gains over the long-run. Contributions from employees and sponsors make up a small part of assets. Over 2/3 of the growth in assets comes from investment gains, not contributions, a true testament of the power of compounding but more importantly, of  the governance of these plans which allows them to attract professionals who can add significant value-added over public market benchmarks, lowering the cost of these plans.

Fifth, apart from these benefits, DB plans offer Canadians safe and predictable income streams when they retire, which means they can count on their pension payouts to continue consuming in their golden years. More consumption means more economic activity, more government revenue from sales and property taxes and less money spent on guaranteed income supplements (GIS) to individuals living in pension poverty. All this will help Canada’s long-term debt profile, something which should please the folks at the Fraser Institute.

Lastly, all these claims that private savings plans are “more flexible” should be taken with a shaker of salt. “Pay down your mortgage” on your grossly over-valued house or condo and “pay down student debt” while you retire in poverty doesn’t really offer Canadians the flexibility they need or want.

In short, all these studies and articles criticizing the ORPP are fundamentally flawed and grossly biased to the point where I’d be embarrassed if I had my name on any of them. These Canadian think tanks are nothing more than claptraps for Canada’s powerful financial services industry. I would ignore anything they publish on public pensions.


Photo credit: “Canada blank map” by Lokal_Profil image cut to remove USA by Paul Robinson – Vector map BlankMap-USA-states-Canada-provinces.svg.Modified by Lokal_Profil. Licensed under CC BY-SA 2.5 via Wikimedia Commons – http://commons.wikimedia.org/wiki/File:Canada_blank_map.svg#mediaviewer/File:Canada_blank_map.svg

Diving Into bcIMC’s 14.2% Return for 2015

bcimc+results

Leo Kolivakis is a blogger, trader and independent senior pension and investment analyst. This post was originally published at Pension Pulse.

Janet McFarland of the Globe and Mail reports, B.C. pension management firm reaps benefits of global markets:

A tactical decision to shift investments into global stock markets paid off last year for British Columbia Investment Management Corp., which earned a 14.2-per-cent return (net of costs) for the year and boosted its total assets to $124-billion.

BCIMC reported it moved more assets into global equities during the fiscal year ended March 31, 2015, while reducing its weighting in fixed income holdings and mortgages, responding to volatility in Canadian stock markets as oil prices declined.

The fund ended the fiscal year with 49.5 per cent of its assets invested in public stock markets, up from 47.6 per cent a year earlier. BCIMC had 21.5 per cent of its holdings in fixed-income securities such as bonds, down slightly from 22 per cent last year, while 14.6 per cent of the portfolio is in real estate, a decline from 17.4 per cent at the end of fiscal 2014.

The fund said its Canadian public equity holdings earned a 7.5-per-cent return last year, while global public equities earned a far higher 23 per cent and emerging markets equities posted 21.4-per-cent gains, illustrating the value of shifting out of Canada’s volatile stock market.

Although the fund adjusted its weightings last year, chief executive officer Gordon Fyfe said it continues to have a long-term investment strategy to ensure member funds are able to deliver pensions to their members.

“Maintaining our discipline, while focusing on due diligence and diversification allows BCIMC to manage market risks so our investments can provide stable cash flows and will appreciate in value over time,” he said in a statement.

BCIMC said investing in passive benchmarks last year would have earned a 12.6-per-cent return, so its active investment strategy added $1.4-billion in additional returns. Over the past 10 years, BCIMC earned an average 8.1-per-cent annualized return, exceeding its benchmark of 7.3 per cent.

BCIMC published its annual report Thursday, showing its executive compensation payments for the past year. Mr. Fyfe, who joined the fund last July, earned $2.2-million in total compensation for the portion of the year he worked, while Lincoln Webb, senior vice-president of private markets, earned $1.27-million in fiscal 2015.

BCIMC oversees investments for B.C. public sector pension plans as well as other government funds. It is Canada’s fourth-largest pension fund manager behind the Canada Pension Plan Investment Board, the Caisse de dépôt et placement du Québec and the Ontario Teachers’ Pension Plan.

You can view bcIMC 2014-2015 Annual Report here. There is an interactive version and a PDF file. You can also view the press release on these results here.

As discussed in the article above, the biggest driver of bcIMC’s results in 2014-2015 was this tactical shift into global equities at the end of March 2014. With a little over half of the assets in global public equities, bcIMC benefited from the “beta boost” and decline in the loonie that other large Canadian pensions benefited from as they shifted public and private assets away from Canada.

On page 17 of the Annual Report, there is a detailed discussion on the drivers of public equities:

Our emerging markets funds were a key driver of returns in our public equity program. The Active Emerging Markets Equity Fund outperformed the benchmark by 7.2 percentage points. Over a four-year period, the fund returned 7.5 per cent against a benchmark of 4.6 per cent. China and India performed exceedingly well and clients benefited from being overweight to these regions. We continued to increase our exposure to China. bcIMC deployed an additional $200 million into the domestic China A-Share market, which gained 120 per cent last year.

Our global equity funds also drove overall returns. The Active Global Equity Fund returned 24.9 per cent against a benchmark of 22.3 per cent. The Thematic Public Equity Fund returned 30.8 per cent against a benchmark of 22.3 per cent. Our exposure to the health care theme was an important driver of the value-added performance.

The chart below from page 12 of the Annual report shows the breakdown in performance of global equity markets during bcIMC’s fiscal 2015 (click on image; total returns all in C$):

As shown above, China significantly outperformed other regions (+100%) mostly owing to the brewing bubble there which is now bursting, but there were solid gains in the U.S. and Japan (+29%), especially when you factor in the decline in the Canadian dollar relative to these currencies.

But the gains didn’t just come from public equities. The table below from page 14 of the Annual report provides a breakdown of returns by asset class (click on image):

As shown, there were solid gains in Private Equity (18.1% vs 15.5% for its benchmark) and gains in Infrastructure and Renewable Resources were decent but not spectacular (9.7% and 8% respectively vs a 7% nominal benchmark). Similarly, gains in Canadian (+7.6%) and Global Real Estate (+9.8%) were decent relative to its benchmark of CPI+4% (+7%) but not spectacular.

(Note: For some reason, the performance of Private Equity, Infrastructure and Renewable Resources is unaudited whereas the performance of Real Estate is audited. No discussion on why this is the case).

As you can see from the table below taken from page 3 of the Annual report, Private Equity, Infrastructure and Renewable Resources make up roughly 11% of total assets (click on image):

Relative to its larger peers, bcIMC was late shifting assets into private equity, which is why that 5% weighting of total assets will double in the coming years. The bulk of private market assets at bcIMC are in Real Estate, which now accounts for 15% of total assets (it was 18% last year when the loonie was stronger).

In order to better understand and fully appreciate bcIMC’s investment approach, I highly recommend you read a March 2014 article from Benefits Canada, How bcIMC is transforming its portfolio, where its former CEO/CIO Doug Pearce goes over their investment portfolio.

In that article, you will read why bcIMC doesn’t invest in hedge funds and how it develops greenfield projects in real estate:

With real estate investments—which account for about 18% of bcIMC’s total portfolio—the company focuses on development (buying land and building on it) rather than on purchasing property. “Returns are greater when we develop,” Pearce says, citing high real estate prices as a reason for this approach. “It’s something the larger pension plans can do in Canada.” Currently, bcIMC has 24 development projects across the country, including office, industrial, retail and multi-family apartment buildings.

The company’s real estate holdings are almost entirely in Canada because this is a market that bcIMC understood when it started these investments. But, as the program matures, it will become more international in the future, Pearce says. By contrast, he adds, the majority (77%) of the agency’s infrastructure investments are outside of the country—generally in developed nations, because fewer of Canada’s infrastructure assets have come to market. Together with renewable resources, infrastructure investments make up 6% of bcIMC’s total portfolio.

However, the corporation doesn’t endorse all alternatives. For example, it has always avoided hedge funds. “In B.C., our clients are relatively conservative. Therefore, putting leverage on the portfolio is very limited,” Pearce explains. “[And] we didn’t like the non-transparency of hedge funds.”

bcIMC’s new CEO/ CIO, Gordon Fyfe, is breaking tradition on hedge funds as the “All Weather” strategy on page 14 from table above is an allocation to Bridgewater. Moreover, he will increasingly focus his attention on private markets, which is what he did when he was running PSP Investments.

The fact that bcIMC’s Real Estate portfolio is almost entirely in Canada makes sense from a liability standpoint but it doesn’t make sense from a diversification standpoint and returns in that asset class didn’t benefit from the decline in the Canadian dollar, which I think will continue as the Canadian economy has turned for the worst.

It is worth noting that the former head of real estate at bcIMC, Mary Garden, has departed the organization. Gordon will be actively looking to replace her as he figures out how to bolster and diversify that asset class.

In his CEO/ CIO report in the Annual Report (starts on page 6), Gordon Fyfe had this to say on enhancing bcIMC’s investment strategies:

Ultimately, bcIMC’s goal is to invest our clients’ money and generate value-added returns. Our clients depend on these returns to pay pensions and insurance obligations long into the future. We must ensure our strategies maximize returns within our clients’ risk parameters. To keep pace with the rapid evolution of the investment world, our investment activities will become increasingly sophisticated and adapt to the changing capital markets.

Updating our investment strategies includes expanding our use of derivatives and leverage in our programs to facilitate cost-effective rebalancing of our clients’ portfolios. We view the use of certain derivative products as an efficient tool to reduce the risk of portfolios, as well as to allow for quicker transitions of assets and to produce higher returns. In short, derivatives can benefit our clients. Similarly, leverage allows us to take advantage of low interest rates, and when used as a strategy, can free up capital to be used elsewhere.

We will also increase our global investment footprint and expand our range of products to ensure our clients can benefit from a wider range of investment opportunities. These include expanding our currency management capabilities, increasing global private market investments, and adding high yield debt.

The use of leverage and derivatives might pave the way to incorporate risk parity strategies and hedge funds in bcIMC’s portfolio (as stated, the “All Weather” strategy on page 14 from table above is an allocation to Bridgewater).

Finally, the table below from page 36 of the Annual Report provides information on the compensation of bcIMC’s senior executives (click on image):

As you you see, Gordon Fyfe enjoyed a total compensation of $2,169,699 in fiscal 2015 after arriving at bcIMC in July 2014, more than twice as much as other senior executives which all made roughly $1 million. Of course, Gordon’s compensation was drastically reduced from the good old days at PSP Investments but he’s still part of Canada’s pension plutocrats and gets to enjoy his millions living in his home town of Victoria, British Columbia where all his family lives.

To be fair, what counts in compensation is long-term performance based on the last four fiscal years and in this regard, bcIMC’s senior managers have exceeded their benchmarks. Also, as Gordon Fyfe stated: “To put this into perspective, we returned 8.1% (annualized) against a 10-year combined benchmark of 7.3%. That translates into $6.9 billion in additional value to our public sector pension
clients.”

I congratulate Gordon and the folks at bcIMC for a solid performance in fiscal 2015 but warn them to start reducing their risk to Chinese public equities and even emerging markets (hope they already did). That trade panned out exceedingly well in fiscal 2015 but it will be a total disaster in fiscal 2016.

On the thematic portfolio, I’m still bullish on U.S. biotechs (IBB or XBI) and by extension healthcare (XLV) which has big biotechs among its holdings and continue to add to my positions in each big biotech dip. I continue to steer clear of Canadian equities and all energy/ commodity shares as my fear remains that global deflation will win over global reflation.


Deprecated: Function get_magic_quotes_gpc() is deprecated in /home/mhuddelson/public_html/pension360.org/wp-includes/formatting.php on line 3712