Deprecated: Methods with the same name as their class will not be constructors in a future version of PHP; Translation_Entry has a deprecated constructor in /home/mhuddelson/public_html/pension360.org/wp-includes/pomo/entry.php on line 14
Deprecated: Methods with the same name as their class will not be constructors in a future version of PHP; POMO_Reader has a deprecated constructor in /home/mhuddelson/public_html/pension360.org/wp-includes/pomo/streams.php on line 12
Deprecated: Methods with the same name as their class will not be constructors in a future version of PHP; POMO_FileReader has a deprecated constructor in /home/mhuddelson/public_html/pension360.org/wp-includes/pomo/streams.php on line 120
Deprecated: Methods with the same name as their class will not be constructors in a future version of PHP; POMO_StringReader has a deprecated constructor in /home/mhuddelson/public_html/pension360.org/wp-includes/pomo/streams.php on line 175
Deprecated: Methods with the same name as their class will not be constructors in a future version of PHP; POMO_CachedFileReader has a deprecated constructor in /home/mhuddelson/public_html/pension360.org/wp-includes/pomo/streams.php on line 221
Deprecated: Methods with the same name as their class will not be constructors in a future version of PHP; POMO_CachedIntFileReader has a deprecated constructor in /home/mhuddelson/public_html/pension360.org/wp-includes/pomo/streams.php on line 236
Deprecated: Methods with the same name as their class will not be constructors in a future version of PHP; WP_Widget_Factory has a deprecated constructor in /home/mhuddelson/public_html/pension360.org/wp-includes/widgets.php on line 544
Deprecated: Function get_magic_quotes_gpc() is deprecated in /home/mhuddelson/public_html/pension360.org/wp-includes/load.php on line 585
Deprecated: Function get_magic_quotes_gpc() is deprecated in /home/mhuddelson/public_html/pension360.org/wp-includes/formatting.php on line 3712
Deprecated: Function get_magic_quotes_gpc() is deprecated in /home/mhuddelson/public_html/pension360.org/wp-includes/formatting.php on line 3712 featured | Pension360 | Page 4 Deprecated: Function get_magic_quotes_gpc() is deprecated in /home/mhuddelson/public_html/pension360.org/wp-includes/formatting.php on line 3712
Deprecated: Function get_magic_quotes_gpc() is deprecated in /home/mhuddelson/public_html/pension360.org/wp-includes/formatting.php on line 3712
Deprecated: Function get_magic_quotes_gpc() is deprecated in /home/mhuddelson/public_html/pension360.org/wp-includes/formatting.php on line 3712
Deprecated: Function get_magic_quotes_gpc() is deprecated in /home/mhuddelson/public_html/pension360.org/wp-includes/formatting.php on line 3712
Deprecated: Function get_magic_quotes_gpc() is deprecated in /home/mhuddelson/public_html/pension360.org/wp-includes/formatting.php on line 3712
Deprecated: Function get_magic_quotes_gpc() is deprecated in /home/mhuddelson/public_html/pension360.org/wp-includes/formatting.php on line 3712
Deprecated: Function get_magic_quotes_gpc() is deprecated in /home/mhuddelson/public_html/pension360.org/wp-includes/formatting.php on line 3712
Deprecated: Function get_magic_quotes_gpc() is deprecated in /home/mhuddelson/public_html/pension360.org/wp-includes/formatting.php on line 3712
Deprecated: Function get_magic_quotes_gpc() is deprecated in /home/mhuddelson/public_html/pension360.org/wp-includes/formatting.php on line 3712
A proposed overhaul of public safety pensions was introduced in the Arizona Senate on Monday.
The proposal is newsworthy because talks have been going on for months, unions have been involved in the process, and at least 25 senators have signed on as co-sponsors – although passage of the plan is far from guaranteed, as voters will have to approve a portion of the bill.
That part of the proposal changes the way yearly benefit increases that are sapping the trust fund are calculated. The way the plan is now set up, excess earnings from the pension trust are put into a fund that doles out automatic increases in most years. The problem is that when the fund sees losses, as it did during the Great Recession, excess cash in flush years can’t make up the difference because it is sent to the cost-of-living-adjustment fund.
The new proposal would change the payout to just actual cost-of-living increases or two percent a year, whichever is greater. Currently, boosts can be as much as 4 percent. That should help stabilize the current fund, which has sunk to just 50 percent of its expected liabilities, with $6.2 billion in assets and $12.7 billion in liabilities.
New hires to police and fire departments statewide would be placed in a new retirement fund with higher employee contributions, minimum age and years of service before full pensions are payable and caps on maximum payouts.
New hires also would be given a choice of opting for a 401(k) style retirement plan rather than a plan with a guaranteed pension. New employees in cities and town agencies that don’t participate in the Social Security system will be given a new 3 percent match to put into a 401(k)-style account.
The bill’s backers are aiming to place the measure on the May 17 ballot. That would require smooth sailing through the Senate and then the House, which isn’t a guarantee.
Photo by: “Entering Arizona on I-10 Westbound” by Wing-Chi Poon – Own work. Licensed under CC BY-SA 2.5 via Wikimedia Commons – http://commons.wikimedia.org/wiki/File:Entering_Arizona_on_I-10_Westbound.jpg#mediaviewer/File:Entering_Arizona_on_I-10_Westbound.jpg
An independent report, commissioned by New York City Comptroller Scott Stringer, found that “operational failure is likely” in the investment office of New York City’s pension funds due to lack of resources and under-staffing, among other things.
The assets of the city’s five pension funds are pooled and managed by the Bureau of Asset Management. That department was the subject of the independent review.
The findings of the report were presented to the trustees on Monday.
The report found that the city’s retirement system, the fourth largest in the country, needs additional resources, is understaffed and lacks many basic tools required to gain insight into the complicated risk embedded in its investments. Some managers rely on fax machines to send and receive vital information.
In some cases, the system, known as the Bureau of Asset Management, does not even have the internal controls necessary to ensure individuals cannot circumvent compliance, the report concluded.
“Operational risk is very high and an operational failure is likely,” the 398-page report, by Funston Advisory Services of Michigan, said.
Funston did not find any specific examples of mismanagement that had resulted directly in a loss of money. Still, the consultant raised a number of troubling issues that could cost the retirement system money, like the inability to properly identify portfolio risk.
[…]
The report found that there were just two people monitoring the $10 billion that the system has invested in private equity. “It is not possible for two individuals to monitor nearly 200 partnerships from 115 managers in a manner so as to properly fulfill fiduciary responsibilities,” the report concluded.
The Bureau of Asset Management oversees $160 billion in assets for the city’s pension funds.
Stausboll, a trained lawyer, took Calpers’ top job during a tough time as investment returns had cratered nearly 30 percent during the financial crisis and the fund was battered by a corruption scandal.
Her predecessor, Fred Buenrostro, pleaded guilty in 2014 to accepting kickbacks in return for steering investment dollars to certain private-equity firms.
“She led us through a difficult period, and we have emerged as a more accountable, transparent, and smarter institution,” Rob Feckner, president of the pension fund’s board, said in a statement.
[…]
On Stausboll’s watch, Calpers’ assets swelled to $276 billion from $170 billion and she pushed the pension fund to flex its muscle in demanding more diversity in board rooms and working to engage more companies on climate change.
Also in 2014, the fund said it would exit its hedge fund investments, calling them too costly and complicated only a few years after becoming one of the first pensions to push into alternative investments like hedge funds.
Before she was at CalPERS, Stausboll served as chief deputy to the California State Treasurer.
Japan’s Government Pension Investment Fund is the largest pension fund in the world, but still delegates most of its investing — even domestic equity management — to external managers.
At a panel discussion on Tuesday, the fund’s CIO said he is eager to bring more investment management in-house, a plan that has been in the works for over a year.
“I’m frequently meeting the CIOs of global pension funds, and when I tell them that most of our investments are outsourced and that only some passive domestic bond investments are in-house, they look amazed, and I’m sick of seeing it,” [GPIF CIO Hiromichi] Mizuno said. “From a global standpoint, GPIF’s investment is behind the curve.”
The government panel is likely to meet about three more times to discuss changes to the law determining what GPIF assets can buy directly. The fund’s own staff managed 867.3 billion yen ($7.4 billion) of active domestic bond investments and 31.4 trillion yen in passive Japanese debt holdings at the end of March.
[…]
If the panel agree GPIF should begin in-house stock investments, the health ministry will draft a bill along with the governance proposal and submit it to the Diet, which runs through mid-June.
By investing directly in equities, GPIF would gain access to more market information and reduce the fees it pays external managers, according to Mizuno. Under the current law, the fund is also unable to invest in derivatives to hedge investments, and this should also be reviewed, he said.
GPIF’s average annual payout in fees to domestic stock managers over the past three years was about 6 billion yen, it said.
Six billion yen, cited in the article as GPIF’s average annual fee payout to domestic stock managers, is equal to approximately $51 million USD.
In 2015, we repeatedly saw some of the U.S.’ largest pension funds push for more diversity on corporate boards.
Last winter, Massachusetts’ pension fund voted to begin using its proxy voting status to push for board diversity from within. Around the same time, a group of nine large pension funds, including CalPERS, CalSTRS and the New York Retirement Fund, penned a letter to the SEC asking for better disclosure of a company’s board diversity.
Research shows that a majority (60%) of institutional investors believe corporate board diversity is important on some level. Nineteen percent believe that diversity is “very important” to strong decision-making.
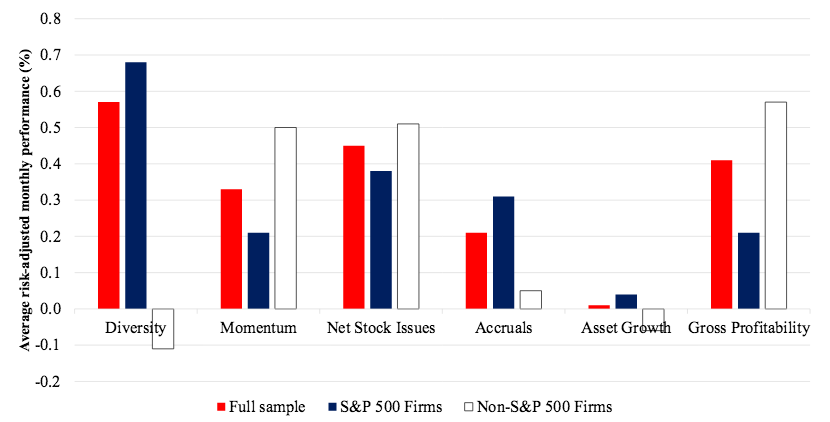
Now, in the largest study yet conducted on the subject, researchers have found that there is significant merit to pensions’ pleas: companies with diverse boards consistently outperform those without.
The findings come from a new paper, Diversity Investing, which examined 50,000 executives from over 5,000 companies dating back to 2002. The paper only looked at professional diversity – background, education, affiliations, etc. Gender and race was not included in the analysis.
Public company leadership with varied career backgrounds have persistently and substantially outperformed stocks from homogenous C-suites, according to the largest study to date on management diversity.
The link was most pronounced in large-cap stocks, contrary to the majority of accepted equity-market performance anomalies.
[…]
Manconi, Rizzo, and Spalt posited three potential drivers of the diversity anomaly.
First, varied expertise among executives could be correlated with an omitted risk factor, although they noted standard risk adjustments failed to produce a likely candidate.
Second, and more likely in the researchers’ view, was a link between diverse management and “quality” stocks. “An attractive feature of this explanation is that a part of the related management literature emphasizes the potential of diverse teams to make better, less biased, decisions,” according to the authors.
Finally, investors could simply undervalue well-rounded leadership, producing persistent mispricing of securities under such teams, or even find them repellent.
“Investors may be more confident assessing the quality of a homogenous team,” the authors wrote—a biotech firm led by biotech veterans inspires optimism. Or allocators and analysts could be put off by “higher perceived ambiguity in the expected performance of a diverse team.”
A report, released recently by executive search firm Russell Reynolds Associates, interviewed institutional investors to find out what governance trends they foresee in 2016.
Likely trends include more shareholder engagement – especially on ESG issues – and a sharper focus on board diversity and composition.
From the section of the report dealing with the United States:
— There will be a focus on improving the quality of engagement between investors and boards, including through individual meetings between investors and board leaders. Some institutional investors have been disappointed by their encounters with directors, describing conversations as formulaic and scripted. The less authentic and more scripted the conversations, the more institutional investors questioned the quality and effectiveness of the board.
— Investors are pushing to have boards designate one or two directors as point people who will engage with investors meaningfully and appropriately about the board’s role in strategy development, executive compensation, and CEO succession planning.
— Boards will start to look for more investor-savvy directors, whether from the investment community or from the ranks of current and former CEOs and CFOs who have dealt with investors regularly.
— At the same time, investors will be under pressure to improve the quality of their own engagement with boards—for example, by limiting “gotcha” questions.
The Exposure Draft, Fiduciary Activities, would establish guidance regarding what constitutes fiduciary activities for financial reporting purposes, the recognition of liabilities to beneficiaries, and how fiduciary activities should be reported. The proposed Statement would apply to all state and local governments.
The Exposure Draft, Certain Asset Retirement Obligations, would establish guidance for determining the timing and pattern of recognition for liabilities related to asset retirement obligations and corresponding deferred outflows of resources. An asset retirement obligation is a legally enforceable liability associated with the retirement of a tangible capital asset, such as the decommissioning of a nuclear reactor.
The Exposure Draft, Pension Issues, addresses practice issues raised by stakeholders during the implementation of Statements No. 67, Financial Reporting for Pension Plans, and No. 68, Accounting and Financial Reporting for Pensions.
Click the links above to view the drafts.
Comments can be submitted for each of the drafts until the following dates:
Pension Issues — February 12, 2016
Fiduciary Activities — March 31, 2016
Certain Asset Retirement Obligations — March 31, 2016.
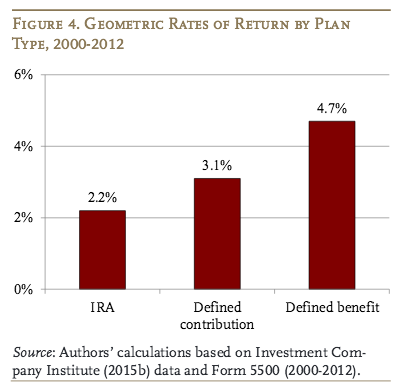
The Boston College Center for Retirement Research (CRR) released a report this week analyzing the investment returns since 1990 for three types of retirement accounts: traditional defined-benefit pensions; 401(k)s; and IRAs.
It found that traditional defined-benefit pensions earned an average of 0.7 percent more each year than defined-contribution 401(k)s — even after controlling for plan size and type of investments.
One reason for the slightly lower returns in 401(k)s is higher fees, which the CRR said “should be a major concern as they can sharply reduce a saver’s nest egg over time.” The same is true for individual retirement accounts (IRAS), which is where much of the money accumulated in 401(k)s is eventually rolled over into. While some researchers have suggested that the difference between defined-benefit and defined-contribution plan returns has declined in recent years, the report said it’s actually larger after 2002.
[…]
The past decade has seen many attempts to shift public employees to 401(k)-style plans in an effort to take the funding burden off governments.
Japan’s 135 trillion yen ($1.1 trillion) Government Pension Investment Fund is building up its alternative investment department after raising bets on infrastructure projects more than 10-fold to secure higher returns than low-yielding bonds.
The world’s largest retiree fund has boosted staff in its alternative investment section, formed last year, to five people, Shinichirou Mori, director of the fund’s planning department, said Dec. 11 in Tokyo. The fund is still trying to hire more people for the department, according to its website.
The fund’s investments in infrastructure rose to about 70 billion yen at the end of September, based on figures supplied by GPIF, up from 5.5 billion yen at the end of March. The decision to invest in infrastructure is drawing interest abroad, with India’s railway minister urging the nation to invest in rail projects there.
“Infrastructure investments can provide stable long-term revenue and so we anticipate it will help steady pension finances,” Mori said in an e-mailed response to questions Dec. 4. “We haven’t set a number on how many people we will add to the department. If there are good people we will hire them.”
Aging Population
Japan’s giant pension manager is shifting to riskier assets to help increase returns as the number of retirees grows and Prime Minister Shinzo Abe’s government tries to spur inflation, which erodes the fixed returns offered by bonds.
Last month the fund posted its worst quarterly result since at least 2008, as a slump in equities hurt returns. GPIF lost 5.6 percent last quarter as China’s yuan devaluation and concern about the potential impact when the Federal Reserve Board raises U.S. interest rates roiled global equity markets.
About 53 percent of the fund’s assets under management were in bonds as of Sept. 30, according to a statement on its website. The retirement fund’s stock investments are largely passive, meaning returns typically track benchmark gauges.The fund held 0.05 percent of its assets in alternative assets at the time, it said.
Canadian Ties
GPIF teamed up in February 2014 with the Ontario Municipal Employees Retirement System and the Development Bank of Japan to jointly invest in infrastructure such as power generation, electricity transmission, gas pipelines and railways in developed countries. It may expand infrastructure investments to as much as 280 billion yen over the next five years as part of the agreement, it said in a statement at the time.
The alternative investment department also can invest in private equity and real estate, although it hasn’t yet, Mori said. The fund will invest as much as five percent of its portfolio — 7 trillion yen as of September — in alternative assets, it said last year. Mori declined to give details of its infrastructure investments.
This year’s infrastructure investments were made through the unit trust structure announced for the joint OMERS projects. The investment decisions are made by Nissay Asset Management Corp. according to the mandate decided by the GPIF. The GPIF team makes sure the details are in line with the investment mandate it outlined for the trust, Mori said.
I recently discussed how Japan’s pension whale got harpooned in Q3 as Japanese equities got slammed that quarter but this big shift into infrastructure is worth noting because it means GPIF will become a huge player in this asset class.
And teaming up with OMERS, which is arguably the best infrastructure investor in the world among global pensions, is a very smart decision. I covered the launch of OMERS’ giant infrastructure fund back in April 2012 and think pensions looking to invest in this asset class should definitely consult them first (there are others like the Caisse, Ontario Teachers, CPPIB and PSP that invest directly in infrastructure but OMERS is widely recognized as a global leader in this asset class).
The manager for Norway’s sovereign wealth fund has bemoaned the smaller scale of infrastructure projects in developing nations after a report to the government called for it be allowed to invest in the asset class.
Noting that infrastructure assets in emerging markets and developing economies present additional challenges not found in OECD countries, a discussion note released by Norges Bank Investment Management (NBIM) nevertheless emphasises that the less mature markets represent “interesting investment opportunities for investors willing and able to take on these additional risks”.
The publication of the note, released alongside a complementary paper discussing the opportunities in renewable energy, comes after the Norwegian government was urged to allow the Government Pension Fund Global (GPFG) to invest in unlisted clean energy and emerging market infrastructure.
In a report co-written by Leo de Bever, former chief executive of the Alberta Investment Management Corporation and commissioned by the Ministry of Finance last year, the government was also urged to broaden the GPFG’s property mandate to allow it to benefit from urbanisation in emerging markets.
The detailed report made a number of suggestions, although the three co-authors – de Bever, Stijn Van Nieuwerburgh of New York University and Richard Stanton of University of California, Berkeley – could not agree whether the sovereign fund should opt for listed or unlisted infrastructure investments, with a 2-1 split in favour of a “substantial” direct infrastructure portfolio (Correction: 2-1 split was in favour of listed infrastructure portfolio).
Van Nieuwerburgh and Stanton were concerned with “myriad non-financial risks” stemming from unlisted holdings, including political and reputational risks, whereas de Bever argued that the sovereign fund’s peers were operating largely in the unlisted space.
Outlining their reasons for investing in emerging market infrastructure, the co-authors cite a strong historical performance but also the “enormous” funding need in such countries, especially after traditional funding sources were in decline.
“The main challenge lies in managing several incremental sources of risk such as political risk, regulatory risk and management and governance risk,” the report says.
It also recommends a greater focus on emerging market property once NBIM has built up sufficient internal expertise.
“Due to urbanisaton, a growing middle class and a rebalancing towards a larger service sector,” it says, “much of the world’s future demand for real estate will be in developing countries.”
The “opening up” to unlisted clean energy would allow NBIM to “explore” the sector, the report’s authors said, adding that clean energy would constitute “a majority” of energy investments over the coming 30 years.
You can view the press release Norway’s pension fund put out here and download the entire report the three co-authors wrote by clicking here.
I contacted Leo de Bever, AIMCo’s former CEO, who was kind enough to provide me with his insights on how Norway’s GPFG should invest in real estate and infrastructure (added emphasis is mine):
Helping to answer Norway’s question whether to invest in more real estate and infrastructure in their GPFG fund has for me highlighted some key differences in academic and practitioner perspectives on investing and taking investment risk. Difference of opinion creates a market. Better ideas should flow from that, provided we all keep an open mind, without getting locked into any single investment paradigm too simplistic to be useful in addressing reality.
I believe that pension managers should have the courage to exploit the very real comparative advantages of stable capital and a long investment horizon. My colleagues on this report put their trust in the short-term efficiency of markets, the futility of trying to earn better than average returns, and the rigour of long-term historical data to guide future investment strategy.
Without seeming to be from Woebegone, I always look for ways to be better than average, by considering how future opportunities could be profitably different from the past. After 40 years of declining interest rates, historical evidence may be particularly suspect, and we will need to rely more on clear thinking than on historical statistics. As I learned long ago building macro-models at the Bank of Canada, present and future problems do not come with a neat data set to fit our econometric tool kits.
Most pension investors share my view that there are economies of scale and short-term market inefficiencies to be exploited. There also is value in going beyond conventional instruments and the zero sum game of listed markets, using long term strategies not accessible to most investors and managers. By definition these approaches cannot be replicated with a sequence of short-term strategies, and they often involve new types of investments that are attractive precisely because they are new and unusual.
Pursuing unusual long-term opportunities comes with personal risks long ago highlighted in Keynes’ observation that it is better for one’s reputation to fail conventionally than to try and succeed unconventionally. If you try to innovative, there will be setbacks, particularly in the short run, and there is no shortage of observers willing to tell you how irresponsible you were in assuming they could be successes. I have the bruises to show for it, but still believe it is the right thing to do. If that all seems too scary, stick with indexing. But if your worry about opportunity cost, factor in Gretsky’s observation that he missed 100% of the shots he never took.
My colleagues on this study analyzed the universe of real estate and infrastructure markets. They concluded that listed and unlisted markets for each of these two asset classes had the same return, and that the listed markets provide the governance advantage of current pricing and liquidity. Since most real estate is unlisted, they agreed Norway had little choice but to invest in unlisted real estate, but since most of the infrastructure they studied was listed, they advised investing in listed infrastructure.
However, no pension manager holds a proportionate slice of the broad real estate and infrastructure markets. They target mostly unlisted subsets of each market based on certain steady return and moderate risk characteristics. From their perspective infrastructure in particular has less to do with what it looks like, than with the economic contract defining its returns. To a long-term investor, lags in unlisted pricing are a nuisance, but the only numbers that ultimately matter are purchase and sale price, and one could question whether current prices are truly efficient. They worry more about the advantage for return of having greater insight and influence on governance at the asset level. As for liquidity, that is largely illusory for a big pension plan.
Based on my own research over the last four years into accelerating technological change, particularly as it relates to water and energy, Norway will have lots of opportunity to combine the profitable and desirable through private investments in more efficient and more environmentally friendly infrastructure. The main hold-up is the historical underpricing of most social infrastructure services like water, sewage, and roads.
As always, attracting private capital will require the right expected return, the right investment structures, and investor trust in the fairness of regulation and the enforceability of long term contracts. The greatest need for infrastructure will be in developing nations, but the political and governance issues will be particularly challenging in those geographies.
When it comes to infrastructure, Leo de Bever knows what he’s talking about. In 2010, the godfather of infrastructure expressed serious concerns on the asset class but he’s absolutely right in his recommendations and insights in this report.
Back in 2004, after I helped Derek Murphy on his board presentation on setting up PSP’s private equity investments, I helped Bruno Guilmette with his board presentation on setting up PSP’s infrastructure investments. I remember looking at the FTSE Infrastructure Index but there was no question whatsoever that unlisted infrastructure offered tremendous opportunities above and beyond what listed infrastructure investments offer over a long investment horizon with no stock market beta.
Are there risks investing in unlisted infrastructure? Of course, there are regulatory risks, currency risks, illiquidity risks and bubble risks which are magnified when every large global pension and sovereign wealth fund is looking to invest in infrastructure projects.
But it’s simply mind-boggling that a giant pension fund like Norway’s GPFG which doesn’t have liquidity constraints and already has too much beta in its portfolio (like Japan’s GPIF) wouldn’t develop its unlisted infrastructure investments. Its senior managers also need to talk to OMERS, the Caisse, Ontario Teachers, PSP, CPPIB, and others on how to go about doing this in an efficient and risk-averse way where they don’t get whacked on pricing or experience regulatory risks.
Having said this, I wouldn’t chuck listed infrastructure out of the equation. There are great infrastructure companies in public markets well worth investing in. I would mix it up but keep the long-term focus on direct investments in unlisted infrastructure and I would use the FTSE Infrastructure Index and a spread to benchmark those unlisted infrastructure investments (I know the FTSE Infrastructure Index is far from perfect which is why many funds use a mix of stocks and bonds as their benchmark for infrastructure and adjust it for illiquidity and leverage).
I’m a stickler for solid benchmarks that properly reflect the risks of underlying investments at each and every investment portfolio of a pension fund, especially those governing private markets where leverage and illiquidity risks are present. Benchmarks are the key to understanding whether compensation adequately reflects the risks senior managers take to beat them. This was not discussed in the report.
Institutional investors new to private equity typically seek to understand the asset class’s performance relative to broad, passive public equity indices such as the S&P 500. Private equity assets share many features with publicly-listed equities, and can behave similarly over the long run. Given these shared features, the use of public equity indices for benchmarking purposes is an accepted standard within the private equity industry, notwithstanding a number of differences between the two asset classes.
Andres Reibel, PhD, is a Vice President in Pantheon’s Technical Research Team.
One fundamental difference between private and public equity investing is that unlike the majority of public equity investment managers, private equity fund managers usually acquire controlling stakes in firms with the goal of implementing material or beneficial change, whether it’s on an operational, financial or managerial level. Therefore, the investment role assumed by a typical private equity fund manager can differ considerably from the role undertaken by a typical public equity fund manager.
Despite the differences, similarities between private equity fund managers and public equity fund managers do exist: one of these is the active portfolio management component. Private equity fund managers aim to seek the most attractive individual company investments when constructing their portfolios and are not constrained by the requirement to consider any specific reference benchmark or index. Similarly, some public equity fund managers will deviate substantially from the public equity benchmark against which their performance will generally be measured.
Nik Morandi is a Partner and Global Head of Portfolio Strategy and Research at Pantheon
Rather than passively tracking a benchmark index, public equity managers will aim to produce outperformance by actively identifying stocks that have the potential to perform more fruitfully than public equity markets overall. Today very few public equity fund managers regard themselves as purely “passive index trackers”, but there is a range based on the level of divergence from the relevant public market index that a particular manager is prepared to bear. The more a public equity fund manager does this, and thereby diverges from an index when constructing its overall portfolio, the more it can be thought of as an “active” equity fund manager1.
Based on our selected dataset and time period, Pantheon’s research finds that private equity has outperformed both passive and active equities on a historical basis, net of management fees and carry, or a percentage of a fund’s profits that private equity managers keep for themselves. Our analysis set out to quantify historical private equity returns from 1990 to 2006 relative to public equity benchmarks, and established significant outperformance against both the passive public equity benchmark as well as an active public equity universe. At the end of this article you will find a link to the complete research including full methodologies.
Comparing U.S. Buyout Funds to the S&P 500 – Passive
One of the most cited pieces of academic research examining the comparative performance of private equity and public equities is a recent study published by Robert Harris, Tim Jenkinson and Steven Kaplan. The study focused on the long-term performance of both U.S. buyouts and U.S. venture funds, based on a comprehensive dataset provided by Burgiss2. We have focused exclusively on the U.S. buyout component of its study3.
Pantheon’s research, building on the work of previous publications such as the Harris et al. study, concluded that investors could have achieved, on average, a 30.5% cumulative outperformance over the S&P 500 (net of fees) when investing in the select buyout funds with a North American geographic focus in the time period from 1990 to 20064.
This analysis was based on the standard Pubic Market Equivalent (“PME”) methodology5 used within the private equity industry to compare private equity against public market benchmarks.
Accessing Top Quartile Buyout Funds
We also thought it would be informative to conduct our own version of the Harris et al. study. Pantheon specifically looked at how upper quartile buyout funds have performed historically relative to the S&P 500 (Harris et al. only examined average performance)6.
When we conducted this exercise (i.e. based on top quartile U.S. buyout funds only7), our dataset generated an 89% net cumulative outperformance over the S&P 500 over the life of the funds. Annualized8, Preqin’s historical dataset suggests that top quartile U.S. private equity buyouts generated an annual net outperformance of approximately 4.9% compared to the S&P 500 (net of fees)9.
Comparing U.S. Buyout Funds to the S&P 500 – Active
Investors in private equity may wish to consider such wider benchmarking applications for their private equity portfolios that goes outside passive public equity benchmarks. This is likely to be more appropriate to the extent they regard a more “active”10 public equity investment style as a closer substitute for their private equity investment program.
It is evident there is a lack of publicly available studies that have assessed the advantages of replacing part of an active public equity portfolio with a comparably active private equity strategy. Thus, Pantheon compared U.S. private equity performance to that of actively-managed U.S. mutual funds, using Bloomberg data11. We calculated PMEs12 for average and top quartile U.S. buyout funds against the average and top quartile active mutual funds from 1990 to 2006; a ‘like-for-like’ comparison of how funds in each category have historically performed relative to each other. Analysis determined a net outperformance of upper quartile U.S. buyout funds relative to the U.S. mutual fund peer group of approximately 3.7% annually. Average U.S. buyouts also outperformed mutual funds by c. 0.4% annually, or approximately 18% on a cumulative basis.
The results appear to provide further evidence in support of the historical outperformance of private equity relative to listed equities regarding the chosen dataset and time period.
Considerations
The performance comparison relative to active public equities may deliver institutional investors with an additional measuring tool when considering how to distribute capital within their equity bucket. Nevertheless, before finalizing any asset allocation decisions, it would be sensible for investors to take into account a number of other factors that were not scrutinized in this evaluation, such as the potential spread of returns and the expected liquidity profiles of different asset classes. Moreover, a particular investor’s own individual preferences and risk tolerance levels should be considered.
However, to the extent investors regard an allocation to an actively-managed public equity program as the “next best alternative” to their private equity program, the results from our research and time period chosen suggests that private equity buyouts may historically have been the better choice.
Nik Morandi is a Partner and Global Head of Portfolio Strategy and Research at Pantheon, and Andres Reibel, PhD is a Vice President in Pantheon’s Technical Research Team.
Please click here to view Pantheon’s full study “Is Private Equity Delivering” or visit www.pantheon.com
______________
Sources
1 “Active” strategies aim to beat the return from a particular market index or benchmark.
2 Burgiss is a well-known provider of information and investment tools for the private equity industry.
3 Throughout this article we have focused exclusively on U.S. buyouts and so we will not be examining the performance of U.S. venture funds.
4 Harris et al. used a private equity dataset from 1984 to 2008. We cut the dataset off at 1990 and 2006 because of the relatively small number of observations from the Burgiss and Preqin data sets prior to 1990 (1984 to 1989) and the immaturity of the 2007 and 2008 vintage funds – whilst some of these vehicles are now over seven years old, many are still in their harvesting phase and so not fully mature. If one included less mature funds then much of the performance would still be included in the net asset value (“NAV”); NAVs are subjective measures of performance and as such less reliable and/or subject to GP-specific judgments regarding valuations. Nevertheless, even based on the entire dataset utilized by Harris et al., the cumulative outperformance of U.S. buyouts relative to the S&P 500 averaged between 20% to 27% over a fund’s life and more than 3% annually. In calculating the cumulative outperformance of 30.5% we took an equally-weighted average of the PMEs within each vintage (1990-2006).
5 As in the academic research study, we focused on Kaplan and Schoar PMEs. Please note that the Preqin data sample generally has more observations in more recent vintages. However, our cumulative average PMEs (for both average U.S. buyouts as well as top quartile U.S. buyouts) are based on an equal weighting across vintages. As a result, we remove any vintage-specific bias or dependency from our results. When calculating the average outperformance of 30.5% from the Harris et al. study (based on average U.S. buyouts with vintage years between 1990 and 2006) we similarly equally-weight across vintages
6 We have excluded bottom quartile funds from our analysis as we are specifically interested in examining how the top quartile cohort would have performed. However, given the dispersion in performance between top and bottom quartile funds in private equity, we believe it is likely that bottom quartile funds would on average have underperformed relative to the S&P 500 on a PME basis over the same time period. Readers should bear this in mind when reviewing the results for the top quartile subset.
7 We again focus on 1990-2006 vintage U.S. buyout funds from the Preqin dataset.
8 We annualized based on actual cashflows from our private equity dataset and therefore the actual duration of the underlying funds (rather than an estimated life). However, to the extent an individual fund was not fully realized (particularly relevant for the more recent vintages) the annualized return was based on the length of time over which data was available.
9 Net of PE fees but gross of low cost ETF fees, which penalizes the PE performance by the annual fees one would have to pay to invest in something like a Vanguard S&P500 ETF.
10 Note that this definition is separate from “activist” public equity investors who, like private equity managers, do seek to effect meaningful operational, managerial or other organizational change within their portfolio companies.
11 The dataset consisted of 2,461 U.S. based mutual funds as provided by Bloomberg whose fund asset class was denoted as “equities”.
12 Note that one needs to subtract one from the average Kaplan and Schoar PMEs to arrive at the cumulative outperformance over the life of the funds. For example, the reader needs to subtract 1 from 1.61 and multiply by 100 to arrive at the cumulative percentage of outperformance for the upper quartile of the U.S. buyout funds over their active mutual fund peers.
Photo by thinkpanama via Flickr CC License
Deprecated: Function get_magic_quotes_gpc() is deprecated in /home/mhuddelson/public_html/pension360.org/wp-includes/formatting.php on line 3712
Deprecated: Function get_magic_quotes_gpc() is deprecated in /home/mhuddelson/public_html/pension360.org/wp-includes/formatting.php on line 3712
Deprecated: Function get_magic_quotes_gpc() is deprecated in /home/mhuddelson/public_html/pension360.org/wp-includes/formatting.php on line 3712